- Written by: ilmarkerm
- Category: Blog entry
- Published: July 17, 2026
Pre-vacation, friday evening, another temporal nugget for you.
EXTRACT from TIMESTAMP WITH TIME ZONE returns values in UTC. This is all documented, but I think quite unintuitive. Just have to keep it in mind.
SQL> with q as (select timestamp'2026-07-17 01:00:00+03:00' t from dual)
  2  select q.t, extract(day from q.t), extract(hour from q.t)
  3  from q;

T                                    EXTRACT(DAYFROMQ.T) EXTRACT(HOURFROMQ.T)
------------------------------------ ------------------- --------------------
2026-07-17 01.00.00,000000000 +03:00                  16                   22
Solution is to convert the value to TIMESTAMP before using EXTRACT.
SQL> with q as (select timestamp'2026-07-17 01:00:00+03:00' t from dual)
  2  select q.t, extract(day from cast(q.t as timestamp)) d, extract(hour from cast(q.t as timestamp)) h
  3  from q;

T                                             D          H
------------------------------------ ---------- ----------
2026-07-17 01.00.00,000000000 +03:00         17          1
Mandatory version information: 19.31
- Written by: ilmarkerm
- Category: Blog entry
- Published: July 17, 2026
Covering indexes are indexes that have all columns present in the index, that the query needs. Removing the need to do an potentially very expensive TABLE ACCESS BY ROWID operation (that fetches the row information from table after locating the rows using an index).
But there is a little gotcha when using covering index on a column with TIMESTAMP WITH TIME ZONE data type.
Oracle silently indexes TIMESTAMP WITH TIME ZONE data type actually as a function SYS_EXTRACT_UTC(column), even if you do not specify the function excplcitly.
CREATE TABLE timestamptz_covering_test (
    v timestamp with time zone not null
);
INSERT INTO timestamptz_covering_test (v) SELECT systimestamp+numtodsinterval(rownum, 'second') from all_objects;
CREATE INDEX idx_timestamptz_covering_test_v on timestamptz_covering_test (v);
What Oracle actually indexed was
CREATE INDEX "IDX_TIMESTAMPTZ_COVERING_TEST_V" ON "TIMESTAMPTZ_COVERING_TEST" (SYS_EXTRACT_UTC("V"));When using the index in WHERE clause, all works as expected, the index is used as an access predicate as expected.
select 1 from timestamptz_covering_test
where v between systimestamp and systimestamp+interval '1' minute;

----------------------------------------------------------------------
| Id  | Operation         | Name                            | E-Rows |
----------------------------------------------------------------------
|   0 | SELECT STATEMENT  |                                 |        |
|*  1 |  FILTER           |                                 |        |
|*  2 |   INDEX RANGE SCAN| IDX_TIMESTAMPTZ_COVERING_TEST_V |     62 |
----------------------------------------------------------------------

Predicate Information (identified by operation id):
---------------------------------------------------

   1 - filter(SYS_EXTRACT_UTC(SYSTIMESTAMP(6)+INTERVAL'+00 00:01:00'
              DAY(2) TO SECOND(0))>=SYS_EXTRACT_UTC(SYSTIMESTAMP(6)))
   2 - access("TIMESTAMPTZ_COVERING_TEST"."SYS_NC00002$">=SYS_EXTRACT_UT
              C(SYSTIMESTAMP(6)) AND "TIMESTAMPTZ_COVERING_TEST"."SYS_NC00002$"<=SYS_E
              XTRACT_UTC(SYSTIMESTAMP(6)+INTERVAL'+00 00:01:00' DAY(2) TO SECOND(0)))
But… If we get into the covering index territory. Look at this example, we are NOT querying any extra columns, only the indexed v column, but suddenly we have TABLE ACCESS BY INDEX ROWID!!!
select v at time zone 'Europe/Tallinn' from timestamptz_covering_test
where v between systimestamp and systimestamp+interval '1' minute

Plan hash value: 3222247287

-----------------------------------------------------------------------------------------
| Id  | Operation                            | Name                            | E-Rows |
-----------------------------------------------------------------------------------------
|   0 | SELECT STATEMENT                     |                                 |        |
|*  1 |  FILTER                              |                                 |        |
|   2 |   TABLE ACCESS BY INDEX ROWID BATCHED| TIMESTAMPTZ_COVERING_TEST       |     62 |
|*  3 |    INDEX RANGE SCAN                  | IDX_TIMESTAMPTZ_COVERING_TEST_V |     62 |
-----------------------------------------------------------------------------------------

Predicate Information (identified by operation id):
---------------------------------------------------

   1 - filter(SYS_EXTRACT_UTC(SYSTIMESTAMP(6)+INTERVAL'+00 00:01:00' DAY(2) TO
              SECOND(0))>=SYS_EXTRACT_UTC(SYSTIMESTAMP(6)))
   3 - access("TIMESTAMPTZ_COVERING_TEST"."SYS_NC00002$">=SYS_EXTRACT_UTC(SYSTIME
              STAMP(6)) AND "TIMESTAMPTZ_COVERING_TEST"."SYS_NC00002$"<=SYS_EXTRACT_UTC(SYSTIME
              STAMP(6)+INTERVAL'+00 00:01:00' DAY(2) TO SECOND(0)))
The reason is simple – SYS_EXTRACT_UTC returns TIMESTAMP data type – so in the index, all time zone information is lost and the original value has to be fetched from the table. In the query we should keep it in mind and rewrite.
select from_tz(sys_extract_utc(v), 'UTC') at time zone 'Europe/Tallinn'
from timestamptz_covering_test
where v between systimestamp and systimestamp+interval '1' minute

Plan hash value: 4012349952

----------------------------------------------------------------------
| Id  | Operation         | Name                            | E-Rows |
----------------------------------------------------------------------
|   0 | SELECT STATEMENT  |                                 |        |
|*  1 |  FILTER           |                                 |        |
|*  2 |   INDEX RANGE SCAN| IDX_TIMESTAMPTZ_COVERING_TEST_V |     62 |
----------------------------------------------------------------------

Predicate Information (identified by operation id):
---------------------------------------------------

   1 - filter(SYS_EXTRACT_UTC(SYSTIMESTAMP(6)+INTERVAL'+00 00:01:00'
              DAY(2) TO SECOND(0))>=SYS_EXTRACT_UTC(SYSTIMESTAMP(6)))
   2 - access("TIMESTAMPTZ_COVERING_TEST"."SYS_NC00002$">=SYS_EXTRACT_UT
              C(SYSTIMESTAMP(6)) AND "TIMESTAMPTZ_COVERING_TEST"."SYS_NC00002$"<=SYS_E
              XTRACT_UTC(SYSTIMESTAMP(6)+INTERVAL'+00 00:01:00' DAY(2) TO SECOND(0)))
All good now.
When you plan to use TIMESTAMP WITH TIME ZONE as a value from index – you have to convert it back to TIMESTAMP WITH TIME ZONE.
FROM_TZ(SYS_EXTRACT_UTC(indexed_column), 'UTC')So just keep it in mind. I just had a case where a query like that had to process about 300000 rows, they created a covering index, but it did not help much. 75% of the time was spent on TABLE ACCESS BY ROWID.
Mandatory version information: 19.31
- Written by: ilmarkerm
- Category: Blog entry
- Published: April 11, 2026
I currently have a customer who wishes to move their internal APEX application into a cloud based hosting, with quite tight budget constraints – and at the same time still need to treat it as production service.
After comparing many options, none which were perfect, the option that we are going for is Oracle Autonomous database APEX workload type. It is significantly cheaper than the full blown Autonomous Database, but it does come with its own quite unique challenges that we need to overcome. APEX service limitations are documented here
The main limitation – there is no connectivity via SQL*Net, all interactions must be done over HTTPS. Everything, including development of database application and deployments.
Side-effect of this restriction is also that there is no-way to have a custom URL (vanity URL) for your application that would also support APEX social login feature (OAuth/OpenID). To overcome that limitation in a full Autonomous Database installation, people usually deploy their own ORDS in front of the Oracle cloud database service. This solution is not usable here.
I will write a few blog posts, on how to work within the restrictions of the APEX workload type database and still keep most of the developer comforts.
Connecting to the database
To work with the database schema you are mainly expected to use the built in APEX SQL workspace and Database Actions SQL Developer web. Mostly enough, but I think we all prefer using our own preferred database clients. Also it is not possible to automate tasks and deploys via the web page.
A few years ago Oracle introduced REST JDBC driver that talks to the database over ORDS SQL endpoint, via HTTP protocol. This ORDS endpoint is accessible, so lets try using it.
The REST JDBC driver does come with restrictions, the main one being that the driver is stateless and does not support transactions. You can read about the driver and its restrictions here
Create ORDS enabled schema
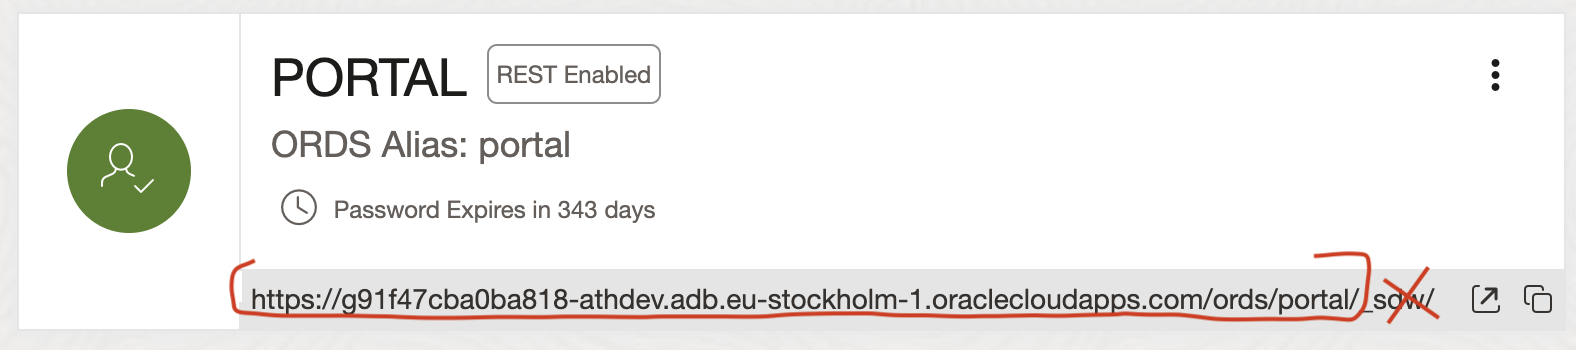
Open Autonomous AI Database and go to Tool configuration. There you see Web access (ORDS) and open its Public access URL. Open SQL Developer web and log in as ADMIN.
Open Administration > Database users and enable schema you want to log in as REST enabled. And copy the REST URL for this schema, minus the last _sdw/ part.
SQLcl
It is possible to connect to the ORDS SQL endpoint using SQLcl, Jeff Smith blogged about it here. Although not all SQLcl functions are available. For example Liquibase and connection manager are not available.
Here I’m using SQLcl 26.1.
- Start SQLcl with /nolog flag
- CONNECT schemaname@RESTUrl
- Or CONNECT schemaname/password@RESTUrl
ilmarkerm@Ilmars-iMac bin % ./sql /nolog

SQLcl: Release 26.1 Production on Sat Apr 11 09:21:40 2026

Copyright (c) 1982, 2026, Oracle.  All rights reserved.

SQL> connect portal@https://g91f47cba0ba818-athdev.adb.eu-stockholm-1.oraclecloudapps.com/ords/portal/
Password? (**********?) **********************
Connected.

SQL> select user, sys_context('userenv','instance_name');

USER      SYS_CONTEXT('USERENV','INSTANCE_NAME')
_________ _________________________________________
PORTAL    fcehldyf3
I can execute usual SQL commands.
SQL> create table t (id number);

Table T created.

SQL> insert into t (id) values (1);

1 row inserted.

SQL> select * from t;

   ID
_____
    1

SQL> begin
  2    for i in 1..100000 loop
  3      insert into t (id) values (i);
  4    end loop;
  5  end;
  6* /

PL/SQL procedure successfully completed.

SQL> select count(*) from t;

   COUNT(*)
___________
     100001

SQL> truncate table t;

Table T truncated.
But the REST driver is stateless, so no transactions (between different calls – inside the same call they work).
SQL> insert into t (id) values (2000000002);

1 row inserted.

SQL> rollback;

Rollback complete.

SQL> select * from t;

           ID
_____________
   2000000002

SQL> begin
  2  insert into t (id) values (30000003);
  3  rollback;
  4  end;
  5* /

PL/SQL procedure successfully completed.

SQL> select * from t;

           ID
_____________
   2000000002
You cannot use SQLcl connection manager for saving the connections.
SQL> conn -save portaldev portal@https://g91f47cba0ba818-athdev.adb.eu-stockholm-1.oraclecloudapps.com/ords/portal/
Connections of type OREST are not supported for saving
Warning: You are no longer connected to ORACLE.
Also built in Liquibase commands give a NullPointer.
SQL> lb generate-changelog
Null Pointer please log a bug.
liquibase.exception.CommandExecutionException: Cannot invoke "String.toUpperCase()" because the return value of "java.sql.DatabaseMetaData.getSQLKeywords()" is null
GUI
I haven’t been successful at connecting DBeaver nor SQL Developer using the Oracle REST driver. DBeaver just gives a lot of internal JDBC errors even if I strip it down to bare minimum of supported features.
java.lang.NullPointerException: Cannot invoke "java.sql.Statement.execute(String)" because the return value of "org.jkiss.dbeaver.model.impl.jdbc.exec.JDBCStatementImpl.getOriginal()" is nullI’ll leave it like that.
- Written by: ilmarkerm
- Category: Blog entry
- Published: April 7, 2026
Procedure to renew service TLS certificates usually (always?) is that you first renew the certificate+key files the service is using and then you also need to signal the running service to reload the configuration files (or restart). If you forget the last part, the service would still continue identifying itself with the old certificate – even past the certificate has expired. Very easy to forget the service reload/restart part.
Usually with Linux programs to make services reload their configuration, including TLS certificates, there is an option to send the program SIGHUP Unix signal. But sadly this does not work for MySQL. Unix signals only flush tables, flush cache and rotate log files https://dev.mysql.com/doc/refman/8.4/en/unix-signal-response.html
Also none of the mysqladmin commands like reload, refresh make a running mysqld service to reload the TLS certificate files.
The only way I have found for a running MySQL instance to reload the certificate files is this ALTER INSTANCE command
ALTER INSTANCE RELOAD TLSDon’t forget to add it also to your SystemD service file, if your certificate renewal automation relies on SystemD reload command. Need to add something like this to the service file (don’t forget about authentication).
ExecReload=mysql -e "alter instance reload tls"Quite an unusual behaviour from MySQL, so do not be caught out. When certificated expire clients cannot connect using TLS anymore and connections fail.
This does not apply if you choose to restart MySQL service, but this comes with the penalty of short downtime.
- Written by: ilmarkerm
- Category: Blog entry
- Published: June 19, 2025
If you are using Oracle Linux cloud images available from https://yum.oracle.com/oracle-linux-templates.html and at some point it does not boot up again and you see it is stuck in the bootloader (grub> prompt), then here are some steps to help you boot it up again. I have used them to rescue OL8 systems.
Oracle Support has a note “Oracle Linux: How to Recover a Non-Booting GRUB2 After Kernel Update (Doc ID 2898390.1)” but these steps do not perfectly work for the provided cloud image.
First check what disk devices are available, for the cloud image you should see this
grub> ls
(hd0) (hd0,msdos1) (hd0,msdos2)
Then check what Linux kernels you have available on this system. You should see vmlinuz ja initramfs file (files) with the matching version number.
grub> ls (hd0,msdos1)/
vmlinux-5.4.17-2136.342.5.el8uek.x86_64 initramfs-5.4.17-2136.342.5.el8uek.x86_64.img
Now boot it up
insmod lvm
insmod normal
insmod gzio
insmod part_gpt
insmod xfs
set root=(hd0,msdos1)
linux /vmlinux-5.4.17-2136.342.5.el8uek.x86_64 root=/dev/mapper/vg_main-lv_root
initrd /initramfs-5.4.17-2136.342.5.el8uek.x86_64.img
boot
After that the system should boot up as normal.
The Oracle Support note claims this can happen due to broken grub.cfg file, but at least the cases I’ve seen grub.cfg has been fine and regenerating it, as the support note recommends, had no help. But at least can temporarily boot up the system again.