Tag: monitoring
- Written by: ilmarkerm
- Category: Blog entry
- Published: November 19, 2024
Tested with ORDS 24.3 running using GraalVM 21.
ORDS documentation has a chapter how to push ORDS metrics to OpenTelemetry endpoint, which also is supported by Prometheus. But Prometheus traditionally is using the opposite method, that Prometheus itself will regularly connect to monitored service endpoints and scrape all its metrics. Similar JavaAgent method can also be deployed to expose ORDS metrics as a traditional Prometheus pull based endpoint.
For this we need to deploy Prometheus JMX exporter as a Java agent in ORDS, this will expose /metrics endpoint that Prometheus can scrape.
First, JMX exporter downloads and documentation is available here.
# Download JMX exporter to ORDS host
curl -o jmx_prometheus_javaagent.jar "https://repo1.maven.org/maven2/io/prometheus/jmx/jmx_prometheus_javaagent/1.0.1/jmx_prometheus_javaagent-1.0.1.jar"
Create configuration file, config.yaml with the following contents. It will format the JMX data into more usable Prometheus metric names.
rules:
    # Reformatting Oracle UCP metrics to have more usable names and adding data types
    - pattern: "oracle.ucp.admin.UniversalConnectionPoolMBean<name=.+, poolName=\\|(.+)\\|(.+)\\|.+><>connectionsClosedCount"
      name: oracle_ucp_connectionsClosedCount
      type: COUNTER
      labels:
          poolName: $1_$2
    - pattern: "oracle.ucp.admin.UniversalConnectionPoolMBean<name=.+, poolName=\\|(.+)\\|(.+)\\|.+><>connectionsCreatedCount"
      name: oracle_ucp_connectionsCreatedCount
      type: COUNTER
      labels:
          poolName: $1_$2
    - pattern: "oracle.ucp.admin.UniversalConnectionPoolMBean<name=.+, poolName=\\|(.+)\\|(.+)\\|.+><>cumulative(\\w+)"
      name: oracle_ucp_cumulative$3
      type: COUNTER
      labels:
          poolName: $1_$2
    - pattern: "oracle.ucp.admin.UniversalConnectionPoolMBean<name=.+, poolName=\\|(.+)\\|(.+)\\|.+><>(\\w+)"
      name: oracle_ucp_$3
      type: GAUGE
      labels:
          poolName: $1_$2
    # This pattern below will add all the rest, tons of detailed java internal things
    # Comment out if you do not want to see them
    - pattern: '.*'
I will assume, that jmx_prometheus_javaagent.jar and config.yaml are placed under /home/ords
Next, change ORDS startup script so it would include the JMX agent. The easiest way is to use environment variable _JAVA_OPTIONS for it.
# Set Startup Java options
# 10.10.10.10 is my local server IP where metrics exporter will bind to, default is localhost
# 21022 is the port JMX exporter will listen to
# With this ORDS metrics would be exposed as http://10.10.10.10:21022/metrics

export _JAVA_OPTIONS="-javaagent:/home/ords/jmx_prometheus_javaagent.jar=10.10.10.10:21022:/home/ords/config.yaml"

# Start ORDS in standalone mode as usual
ords serve
Below is my full ORDS SystemD service file – /etc/systemd/system/ords.service
[Unit]
Description=Oracle Rest Data Services
After=syslog.target network.target

[Service]
Type=simple
User=ords
Group=ords
Restart=always
RestartSec=30
Environment="_JAVA_OPTIONS=-Xms3G -Xmx3G -javaagent:/home/ords/jmx_prometheus_javaagent.jar=10.10.10.10:21022:/home/ords/config.yaml"
Environment="JAVA_HOME=/home/ords/graalvm"
#Environment="JAVA_TOOL_OPTIONS=-Djava.util.logging.config.file=/home/ords/logging.conf"
ExecStart=/home/ords/ords/bin/ords --config /etc/ords/config serve --secure --port 8443 --key /etc/ords/server.key --certificate /etc/ords/server.pem

[Install]
WantedBy=multi-user.target
After restarting ORDS I can query its metrics endpoint.
curl http://10.10.10.10:21022/metrics

# You will see many Java and JVM metrics in the output. Example...
jvm_memory_pool_max_bytes{pool="Compressed Class Space"} 1.073741824E9
jvm_memory_pool_max_bytes{pool="G1 Eden Space"} -1.0
jvm_memory_pool_max_bytes{pool="G1 Old Gen"} 3.221225472E9
jvm_memory_pool_max_bytes{pool="G1 Survivor Space"} -1.0
jvm_memory_pool_max_bytes{pool="Metaspace"} -1.0
jvm_memory_pool_used_bytes{pool="CodeHeap 'non-nmethods'"} 1822336.0
jvm_memory_pool_used_bytes{pool="CodeHeap 'non-profiled nmethods'"} 5918080.0
jvm_memory_pool_used_bytes{pool="CodeHeap 'profiled nmethods'"} 2.3397888E7
jvm_memory_pool_used_bytes{pool="Compressed Class Space"} 7328848.0
jvm_memory_pool_used_bytes{pool="G1 Eden Space"} 2.57949696E8
jvm_memory_pool_used_bytes{pool="G1 Old Gen"} 2.280663304E9
jvm_memory_pool_used_bytes{pool="G1 Survivor Space"} 8528.0
jvm_memory_pool_used_bytes{pool="Metaspace"} 6.750048E7
jvm_memory_used_bytes{area="heap"} 2.538621528E9
jvm_memory_used_bytes{area="nonheap"} 1.05967632E8
jvm_threads_deadlocked_monitor 0.0
jvm_threads_peak 62.0
jvm_threads_started_total 62.0
jvm_threads_state{state="BLOCKED"} 0.0
jvm_threads_state{state="NEW"} 0.0
jvm_threads_state{state="RUNNABLE"} 12.0
jvm_threads_state{state="TERMINATED"} 0.0
jvm_threads_state{state="TIMED_WAITING"} 20.0
jvm_threads_state{state="UNKNOWN"} 0.0
jvm_threads_state{state="WAITING"} 15.0

# ORDS database connection pool metrics will be exported like this
# Just an example... all UCP attributes are exported, for all ORDS connection pools

oracle_ucp_abandonedConnectionTimeout{poolName="backoffice_lo"} 0.0
oracle_ucp_abandonedConnectionTimeout{poolName="marketing_communications_2_lo"} 0.0
oracle_ucp_abandonedConnectionsCount{poolName="backoffice_lo"} 0.0
oracle_ucp_abandonedConnectionsCount{poolName="marketing_communications_2_lo"} 0.0
oracle_ucp_availableConnectionsCount{poolName="backoffice_lo"} 10.0
oracle_ucp_availableConnectionsCount{poolName="marketing_communications_2_lo"} 10.0
oracle_ucp_averageBorrowedConnectionsCount{poolName="backoffice_lo"} 1.0
oracle_ucp_averageBorrowedConnectionsCount{poolName="marketing_communications_2_lo"} 1.0
oracle_ucp_averageConnectionWaitTime{poolName="backoffice_lo"} 0.0
oracle_ucp_averageConnectionWaitTime{poolName="marketing_communications_2_lo"} 0.0
oracle_ucp_borrowedConnectionsCount{poolName="backoffice_lo"} 0.0
oracle_ucp_borrowedConnectionsCount{poolName="marketing_communications_2_lo"} 0.0
oracle_ucp_bufferSize{poolName="backoffice_lo"} 1024.0
oracle_ucp_bufferSize{poolName="marketing_communications_2_lo"} 1024.0
oracle_ucp_connectionHarvestMaxCount{poolName="backoffice_lo"} 1.0
oracle_ucp_connectionHarvestMaxCount{poolName="marketing_communications_2_lo"} 1.0
oracle_ucp_connectionHarvestTriggerCount{poolName="backoffice_lo"} 2.147483647E9
oracle_ucp_connectionHarvestTriggerCount{poolName="marketing_communications_2_lo"} 2.147483647E9
oracle_ucp_connectionRepurposeCount{poolName="backoffice_lo"} 0.0
oracle_ucp_connectionRepurposeCount{poolName="marketing_communications_2_lo"} 0.0
oracle_ucp_connectionValidationTimeout{poolName="backoffice_lo"} 15.0
oracle_ucp_connectionValidationTimeout{poolName="marketing_communications_2_lo"} 15.0
oracle_ucp_connectionWaitTimeout{poolName="backoffice_lo"} 3.0
oracle_ucp_connectionWaitTimeout{poolName="marketing_communications_2_lo"} 3.0
oracle_ucp_connectionsClosedCount{poolName="backoffice_lo"} 0.0
oracle_ucp_connectionsClosedCount{poolName="marketing_communications_2_lo"} 0.0
oracle_ucp_connectionsCreatedCount{poolName="backoffice_lo"} 10.0
oracle_ucp_connectionsCreatedCount{poolName="marketing_communications_2_lo"} 10.0
oracle_ucp_createConnectionInBorrowThread{poolName="backoffice_lo"} 1.0
oracle_ucp_createConnectionInBorrowThread{poolName="marketing_communications_2_lo"} 1.0
oracle_ucp_cumulativeConnectionBorrowedCount{poolName="backoffice_lo"} 1.0
oracle_ucp_cumulativeConnectionBorrowedCount{poolName="marketing_communications_2_lo"} 1.0
oracle_ucp_cumulativeConnectionReturnedCount{poolName="backoffice_lo"} 1.0
oracle_ucp_cumulativeConnectionReturnedCount{poolName="marketing_communications_2_lo"} 1.0
oracle_ucp_cumulativeConnectionUseTime{poolName="backoffice_lo"} 60.0
oracle_ucp_cumulativeConnectionUseTime{poolName="marketing_communications_2_lo"} 30.0
oracle_ucp_cumulativeConnectionWaitTime{poolName="backoffice_lo"} 0.0
oracle_ucp_cumulativeConnectionWaitTime{poolName="marketing_communications_2_lo"} 0.0
oracle_ucp_cumulativeFailedConnectionWaitCount{poolName="backoffice_lo"} 0.0
oracle_ucp_cumulativeFailedConnectionWaitCount{poolName="marketing_communications_2_lo"} 0.0
oracle_ucp_cumulativeFailedConnectionWaitTime{poolName="backoffice_lo"} 0.0
oracle_ucp_cumulativeFailedConnectionWaitTime{poolName="marketing_communications_2_lo"} 0.0
oracle_ucp_cumulativeSuccessfulConnectionWaitCount{poolName="backoffice_lo"} 0.0
oracle_ucp_cumulativeSuccessfulConnectionWaitCount{poolName="marketing_communications_2_lo"} 0.0
oracle_ucp_cumulativeSuccessfulConnectionWaitTime{poolName="backoffice_lo"} 0.0
oracle_ucp_cumulativeSuccessfulConnectionWaitTime{poolName="marketing_communications_2_lo"} 0.0
oracle_ucp_failedAffinityBasedBorrowCount{poolName="backoffice_lo"} 0.0
oracle_ucp_failedAffinityBasedBorrowCount{poolName="marketing_communications_2_lo"} 0.0
oracle_ucp_failedRCLBBasedBorrowCount{poolName="backoffice_lo"} 0.0
oracle_ucp_failedRCLBBasedBorrowCount{poolName="marketing_communications_2_lo"} 0.0
oracle_ucp_failoverEnabled{poolName="backoffice_lo"} 0.0
oracle_ucp_failoverEnabled{poolName="marketing_communications_2_lo"} 0.0
oracle_ucp_inactiveConnectionTimeout{poolName="backoffice_lo"} 1800.0
oracle_ucp_inactiveConnectionTimeout{poolName="marketing_communications_2_lo"} 1800.0
oracle_ucp_initialPoolSize{poolName="backoffice_lo"} 10.0
oracle_ucp_initialPoolSize{poolName="marketing_communications_2_lo"} 10.0
oracle_ucp_labeledConnectionsCount{poolName="backoffice_lo"} 0.0
oracle_ucp_labeledConnectionsCount{poolName="marketing_communications_2_lo"} 0.0
oracle_ucp_loggingEnabled{poolName="backoffice_lo"} 0.0
oracle_ucp_loggingEnabled{poolName="marketing_communications_2_lo"} 0.0
oracle_ucp_maxConnectionReuseCount{poolName="backoffice_lo"} 1000.0- Written by: ilmarkerm
- Category: Blog entry
- Published: January 17, 2021
I wanted to share some of the Grafana dashboards I’ve built recently to monitor Oracle database environments. Images for now, for your inspiration, so you could build your own.
First up is Oracle database listener. Listener log is a very valuable source of information, that I think is often overlooked. For example just from monitoring listener logs you can get real time information if clients can connect to the database successfully or they get some error. Or so some specific client get an error only (misconfigured client), or some forgotten app is still running is hammering the listener with service name that does not exist anymore. Maybe some client is misbehaving and is trying to connect hundreds of times per second to the database, you will see it from the listener log, with the client information. Who are the clients still connecting with TCP and have not yet migrated over to TCPS connections like DBA-s are demanding? And so on.
And from grafana you can also generate alerts.
Here is the current state of my listener dashboard (this one is for human operators to drill down into issues, I have another dashboard for automatic alerts).
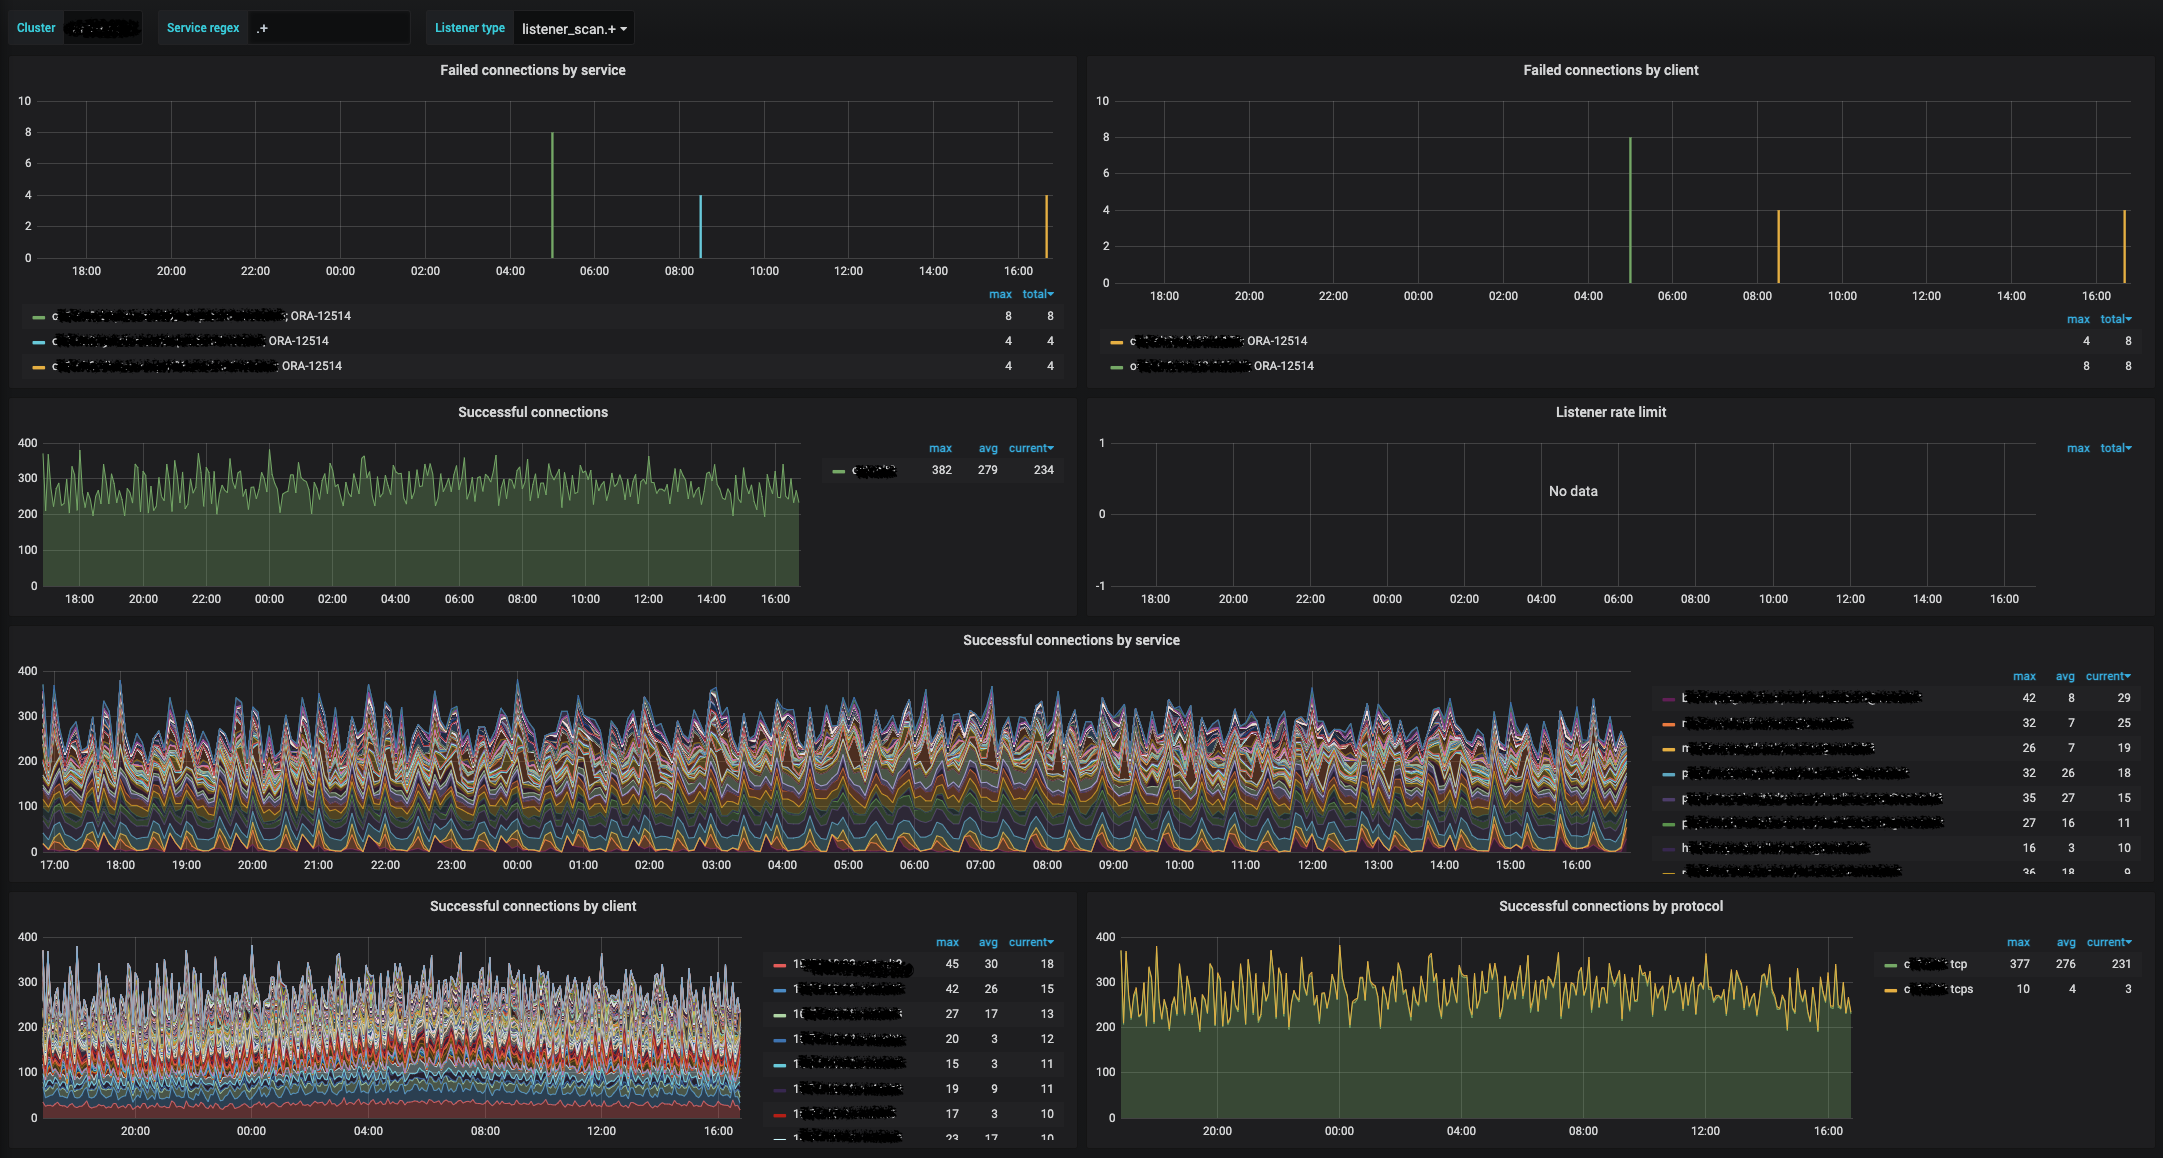
Data collector was published earlier:
Some InfluxQL queries behind these panels:
I think “Failed connections by service” is a very good metric to create an alert on.
- Written by: ilmarkerm
- Category: Blog entry
- Published: January 17, 2021
To continue my previous post abiout ADR log mining, another monitoring agent that I created was just a very simple (initially) Linux monitoring agent. System metrics.
I know there are plenty of existing software products already doing exactly that, but I don’t really like the one that was chosen by my employer – other people maintaining it for different goals. Also I wanted to have much richer metadata (and Oracle specific – like cluster name) added to the monitoring data.
Here is the code:
https://github.com/ilmarkerm/monitoring/blob/main/linux/system-monitor.py
Cheap to run and just uses regular expressions to parse information returned by standard Linux monitoring command. Data is again sent to InfluxDB backend intended to be used in Grafana dashboards.
I push it out using Ansible, so I left in some Ansible tags in the configuration section… and so pleople would not just blindly take the code and try to run it without understanding it 🙂
- Written by: ilmarkerm
- Category: Blog entry
- Published: January 17, 2021
For a while now Oracle is using standardised log structure under Automatic Diagnostic Repository (ADR) – this includes database alert.log, listener log, CRS log, ASM log and much more. All this is very valuable information for monitoring.
I’m a fan of using Grafana (using InfluxDB as a data source) for monitoring, since in Grafana it is very easy to create your own customised dashboards and alerts – so lately I’ve ben creating my own monitoring agents to gather send Oracle monitoring information to InfluxDB.
InfluxDB is fast time series database, perfect for storing monitoring data – each record must have timestamp associated and data retention is also natively built in.
Since our Oracle environment is exploding in size, my goal is also to have monitoring tools/agents that figure out what to do themselves, deployed using Ansible. All without any human involvment.
Here is monitoring agent with following high level features:
- Searches for all recently modified alert/log.xml files under ADR base
- Parses newly added log messages for any tags that Oracle itself has added (like component and message level)
- Parses log messages against custom regular expressions to parse out custom information
Code is here:
https://github.com/ilmarkerm/monitoring/blob/main/oracle/adr-log.py
It is expected to run as SystemD service. I currently left in some Ansible tags, since this is how I distribute the agent to all servers (and to make sure people do no just take the code and run it without reading and understanding it).