Archives: Monitoring Oracle listener from Grafana
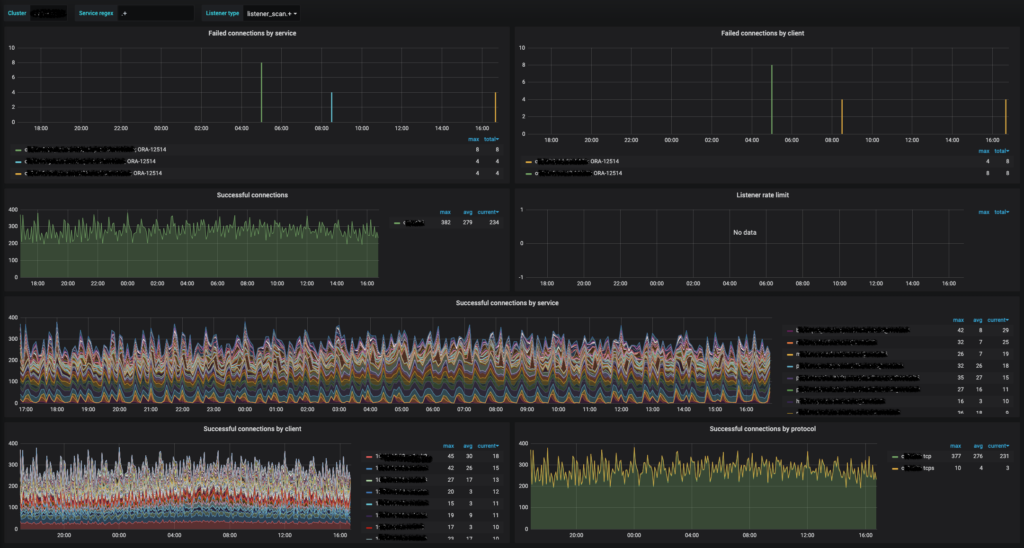
I wanted to share some of the Grafana dashboards I’ve built recently to monitor Oracle database environments. Images for now, for your inspiration, so you could build your own.
First up is Oracle database listener. Listener log is a very valuable source of information, that I think is often overlooked. For example just from monitoring listener logs you can get real time information if clients can connect to the database successfully or they get some error. Or so some specific client get an error only (misconfigured client), or some forgotten app is still running is hammering the listener with service name that does not exist anymore. Maybe some client is misbehaving and is trying to connect hundreds of times per second to the database, you will see it from the listener log, with the client information. Who are the clients still connecting with TCP and have not yet migrated over to TCPS connections like DBA-s are demanding? And so on.
And from grafana you can also generate alerts.
Here is the current state of my listener dashboard (this one is for human operators to drill down into issues, I have another dashboard for automatic alerts).

Data collector was published earlier:
Some InfluxQL queries behind these panels:
I think “Failed connections by service” is a very good metric to create an alert on.
Archives: Managing Oracle database listener with SystemD
SystemD is standard today in the Linux world, and it is very powerful and good, I really like it.
Wouldn’t it be nice to manage Oracle database components also with SystemD? Not just simple starting and stopping, but also making sure it keeps running and restarts it automatically if needed.
I also want to manage listener separately from the database instances, since one listener can service multiple database instances and also keeping automation and automated out-of-place patching in mind – listener does not need to run from the same home as database instance.
Realistic example: you need to wait for months until Oracle support creates you an essential merge patch for the database, but before that you can already run listener with the latest Release Update Revision, that fixes the latest security bugs.
Here is the code:
oracle-listener.service is the SystemD unit file. I have intended it to be pushed out centrally from Ansible, so the content there is generated automatically, for example the Oracle Home path, the the PID file location.
get_listener_pid.sh the purpose of this script is to return the listener process PID (tnslsnr) to SystemD, so it could keep an eye on it, and restart if it happens to die. Rather long script for such a simple task, but we are dealing with Oracle here, and instead of just returning a simple process PID, “lsnrctl show pid” has a lot on unnecessary clutter in the output.
Archives: System monitoring agent
To continue my previous post abiout ADR log mining, another monitoring agent that I created was just a very simple (initially) Linux monitoring agent. System metrics.
I know there are plenty of existing software products already doing exactly that, but I don’t really like the one that was chosen by my employer – other people maintaining it for different goals. Also I wanted to have much richer metadata (and Oracle specific – like cluster name) added to the monitoring data.
Here is the code:
https://github.com/ilmarkerm/monitoring/blob/main/linux/system-monitor.py
Cheap to run and just uses regular expressions to parse information returned by standard Linux monitoring command. Data is again sent to InfluxDB backend intended to be used in Grafana dashboards.
I push it out using Ansible, so I left in some Ansible tags in the configuration section… and so pleople would not just blindly take the code and try to run it without understanding it 🙂
Archives: Mining log files under ADR base
For a while now Oracle is using standardised log structure under Automatic Diagnostic Repository (ADR) – this includes database alert.log, listener log, CRS log, ASM log and much more. All this is very valuable information for monitoring.
I’m a fan of using Grafana (using InfluxDB as a data source) for monitoring, since in Grafana it is very easy to create your own customised dashboards and alerts – so lately I’ve ben creating my own monitoring agents to gather send Oracle monitoring information to InfluxDB.
InfluxDB is fast time series database, perfect for storing monitoring data – each record must have timestamp associated and data retention is also natively built in.
Since our Oracle environment is exploding in size, my goal is also to have monitoring tools/agents that figure out what to do themselves, deployed using Ansible. All without any human involvment.
Here is monitoring agent with following high level features:
- Searches for all recently modified alert/log.xml files under ADR base
- Parses newly added log messages for any tags that Oracle itself has added (like component and message level)
- Parses log messages against custom regular expressions to parse out custom information
Code is here:
https://github.com/ilmarkerm/monitoring/blob/main/oracle/adr-log.py
It is expected to run as SystemD service. I currently left in some Ansible tags, since this is how I distribute the agent to all servers (and to make sure people do no just take the code and run it without reading and understanding it).
Categories
- Blog entry
 (103)
(103)
- Event
 (5)
(5)