Monitoring Oracle listener from Grafana
- Written by: ilmarkerm
- Category: Blog entry
- Published: January 17, 2021
I wanted to share some of the Grafana dashboards I’ve built recently to monitor Oracle database environments. Images for now, for your inspiration, so you could build your own.
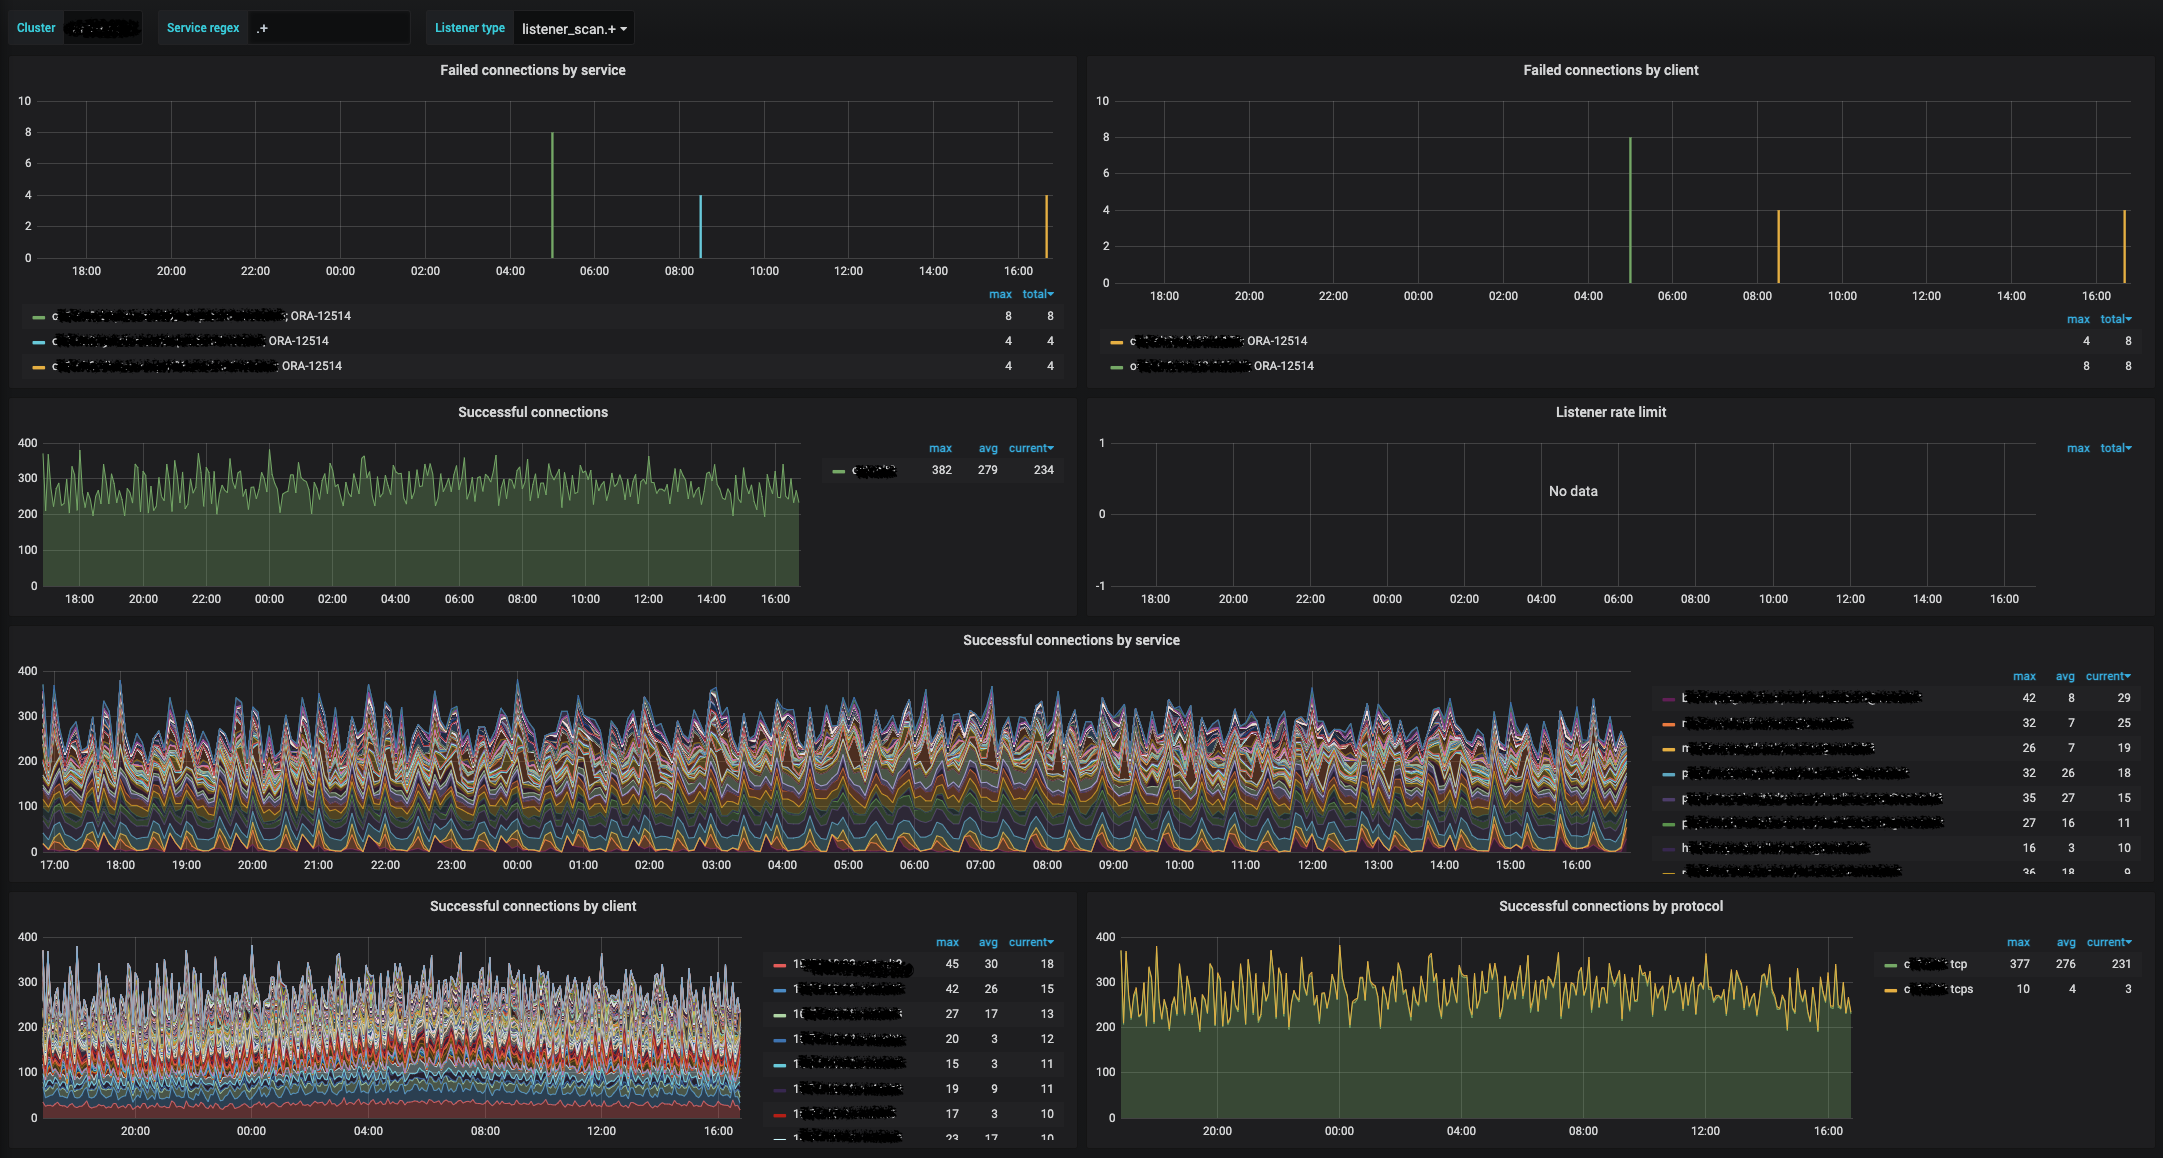
First up is Oracle database listener. Listener log is a very valuable source of information, that I think is often overlooked. For example just from monitoring listener logs you can get real time information if clients can connect to the database successfully or they get some error. Or so some specific client get an error only (misconfigured client), or some forgotten app is still running is hammering the listener with service name that does not exist anymore. Maybe some client is misbehaving and is trying to connect hundreds of times per second to the database, you will see it from the listener log, with the client information. Who are the clients still connecting with TCP and have not yet migrated over to TCPS connections like DBA-s are demanding? And so on.
And from grafana you can also generate alerts.
Here is the current state of my listener dashboard (this one is for human operators to drill down into issues, I have another dashboard for automatic alerts).
Data collector was published earlier:
Some InfluxQL queries behind these panels:
I think “Failed connections by service” is a very good metric to create an alert on.