Tag: oracle
- Written by: ilmarkerm
- Category: Blog entry
- Published: July 17, 2026
Pre-vacation, friday evening, another temporal nugget for you.
EXTRACT from TIMESTAMP WITH TIME ZONE returns values in UTC. This is all documented, but I think quite unintuitive. Just have to keep it in mind.
SQL> with q as (select timestamp'2026-07-17 01:00:00+03:00' t from dual)
  2  select q.t, extract(day from q.t), extract(hour from q.t)
  3  from q;

T                                    EXTRACT(DAYFROMQ.T) EXTRACT(HOURFROMQ.T)
------------------------------------ ------------------- --------------------
2026-07-17 01.00.00,000000000 +03:00                  16                   22
Solution is to convert the value to TIMESTAMP before using EXTRACT.
SQL> with q as (select timestamp'2026-07-17 01:00:00+03:00' t from dual)
  2  select q.t, extract(day from cast(q.t as timestamp)) d, extract(hour from cast(q.t as timestamp)) h
  3  from q;

T                                             D          H
------------------------------------ ---------- ----------
2026-07-17 01.00.00,000000000 +03:00         17          1
Mandatory version information: 19.31
- Written by: ilmarkerm
- Category: Blog entry
- Published: July 17, 2026
Covering indexes are indexes that have all columns present in the index, that the query needs. Removing the need to do an potentially very expensive TABLE ACCESS BY ROWID operation (that fetches the row information from table after locating the rows using an index).
But there is a little gotcha when using covering index on a column with TIMESTAMP WITH TIME ZONE data type.
Oracle silently indexes TIMESTAMP WITH TIME ZONE data type actually as a function SYS_EXTRACT_UTC(column), even if you do not specify the function excplcitly.
CREATE TABLE timestamptz_covering_test (
    v timestamp with time zone not null
);
INSERT INTO timestamptz_covering_test (v) SELECT systimestamp+numtodsinterval(rownum, 'second') from all_objects;
CREATE INDEX idx_timestamptz_covering_test_v on timestamptz_covering_test (v);
What Oracle actually indexed was
CREATE INDEX "IDX_TIMESTAMPTZ_COVERING_TEST_V" ON "TIMESTAMPTZ_COVERING_TEST" (SYS_EXTRACT_UTC("V"));When using the index in WHERE clause, all works as expected, the index is used as an access predicate as expected.
select 1 from timestamptz_covering_test
where v between systimestamp and systimestamp+interval '1' minute;

----------------------------------------------------------------------
| Id  | Operation         | Name                            | E-Rows |
----------------------------------------------------------------------
|   0 | SELECT STATEMENT  |                                 |        |
|*  1 |  FILTER           |                                 |        |
|*  2 |   INDEX RANGE SCAN| IDX_TIMESTAMPTZ_COVERING_TEST_V |     62 |
----------------------------------------------------------------------

Predicate Information (identified by operation id):
---------------------------------------------------

   1 - filter(SYS_EXTRACT_UTC(SYSTIMESTAMP(6)+INTERVAL'+00 00:01:00'
              DAY(2) TO SECOND(0))>=SYS_EXTRACT_UTC(SYSTIMESTAMP(6)))
   2 - access("TIMESTAMPTZ_COVERING_TEST"."SYS_NC00002$">=SYS_EXTRACT_UT
              C(SYSTIMESTAMP(6)) AND "TIMESTAMPTZ_COVERING_TEST"."SYS_NC00002$"<=SYS_E
              XTRACT_UTC(SYSTIMESTAMP(6)+INTERVAL'+00 00:01:00' DAY(2) TO SECOND(0)))
But… If we get into the covering index territory. Look at this example, we are NOT querying any extra columns, only the indexed v column, but suddenly we have TABLE ACCESS BY INDEX ROWID!!!
select v at time zone 'Europe/Tallinn' from timestamptz_covering_test
where v between systimestamp and systimestamp+interval '1' minute

Plan hash value: 3222247287

-----------------------------------------------------------------------------------------
| Id  | Operation                            | Name                            | E-Rows |
-----------------------------------------------------------------------------------------
|   0 | SELECT STATEMENT                     |                                 |        |
|*  1 |  FILTER                              |                                 |        |
|   2 |   TABLE ACCESS BY INDEX ROWID BATCHED| TIMESTAMPTZ_COVERING_TEST       |     62 |
|*  3 |    INDEX RANGE SCAN                  | IDX_TIMESTAMPTZ_COVERING_TEST_V |     62 |
-----------------------------------------------------------------------------------------

Predicate Information (identified by operation id):
---------------------------------------------------

   1 - filter(SYS_EXTRACT_UTC(SYSTIMESTAMP(6)+INTERVAL'+00 00:01:00' DAY(2) TO
              SECOND(0))>=SYS_EXTRACT_UTC(SYSTIMESTAMP(6)))
   3 - access("TIMESTAMPTZ_COVERING_TEST"."SYS_NC00002$">=SYS_EXTRACT_UTC(SYSTIME
              STAMP(6)) AND "TIMESTAMPTZ_COVERING_TEST"."SYS_NC00002$"<=SYS_EXTRACT_UTC(SYSTIME
              STAMP(6)+INTERVAL'+00 00:01:00' DAY(2) TO SECOND(0)))
The reason is simple – SYS_EXTRACT_UTC returns TIMESTAMP data type – so in the index, all time zone information is lost and the original value has to be fetched from the table. In the query we should keep it in mind and rewrite.
select from_tz(sys_extract_utc(v), 'UTC') at time zone 'Europe/Tallinn'
from timestamptz_covering_test
where v between systimestamp and systimestamp+interval '1' minute

Plan hash value: 4012349952

----------------------------------------------------------------------
| Id  | Operation         | Name                            | E-Rows |
----------------------------------------------------------------------
|   0 | SELECT STATEMENT  |                                 |        |
|*  1 |  FILTER           |                                 |        |
|*  2 |   INDEX RANGE SCAN| IDX_TIMESTAMPTZ_COVERING_TEST_V |     62 |
----------------------------------------------------------------------

Predicate Information (identified by operation id):
---------------------------------------------------

   1 - filter(SYS_EXTRACT_UTC(SYSTIMESTAMP(6)+INTERVAL'+00 00:01:00'
              DAY(2) TO SECOND(0))>=SYS_EXTRACT_UTC(SYSTIMESTAMP(6)))
   2 - access("TIMESTAMPTZ_COVERING_TEST"."SYS_NC00002$">=SYS_EXTRACT_UT
              C(SYSTIMESTAMP(6)) AND "TIMESTAMPTZ_COVERING_TEST"."SYS_NC00002$"<=SYS_E
              XTRACT_UTC(SYSTIMESTAMP(6)+INTERVAL'+00 00:01:00' DAY(2) TO SECOND(0)))
All good now.
When you plan to use TIMESTAMP WITH TIME ZONE as a value from index – you have to convert it back to TIMESTAMP WITH TIME ZONE.
FROM_TZ(SYS_EXTRACT_UTC(indexed_column), 'UTC')So just keep it in mind. I just had a case where a query like that had to process about 300000 rows, they created a covering index, but it did not help much. 75% of the time was spent on TABLE ACCESS BY ROWID.
Mandatory version information: 19.31
- Written by: ilmarkerm
- Category: Blog entry
- Published: April 11, 2026
I currently have a customer who wishes to move their internal APEX application into a cloud based hosting, with quite tight budget constraints – and at the same time still need to treat it as production service.
After comparing many options, none which were perfect, the option that we are going for is Oracle Autonomous database APEX workload type. It is significantly cheaper than the full blown Autonomous Database, but it does come with its own quite unique challenges that we need to overcome. APEX service limitations are documented here
The main limitation – there is no connectivity via SQL*Net, all interactions must be done over HTTPS. Everything, including development of database application and deployments.
Side-effect of this restriction is also that there is no-way to have a custom URL (vanity URL) for your application that would also support APEX social login feature (OAuth/OpenID). To overcome that limitation in a full Autonomous Database installation, people usually deploy their own ORDS in front of the Oracle cloud database service. This solution is not usable here.
I will write a few blog posts, on how to work within the restrictions of the APEX workload type database and still keep most of the developer comforts.
Connecting to the database
To work with the database schema you are mainly expected to use the built in APEX SQL workspace and Database Actions SQL Developer web. Mostly enough, but I think we all prefer using our own preferred database clients. Also it is not possible to automate tasks and deploys via the web page.
A few years ago Oracle introduced REST JDBC driver that talks to the database over ORDS SQL endpoint, via HTTP protocol. This ORDS endpoint is accessible, so lets try using it.
The REST JDBC driver does come with restrictions, the main one being that the driver is stateless and does not support transactions. You can read about the driver and its restrictions here
Create ORDS enabled schema
Open Autonomous AI Database and go to Tool configuration. There you see Web access (ORDS) and open its Public access URL. Open SQL Developer web and log in as ADMIN.
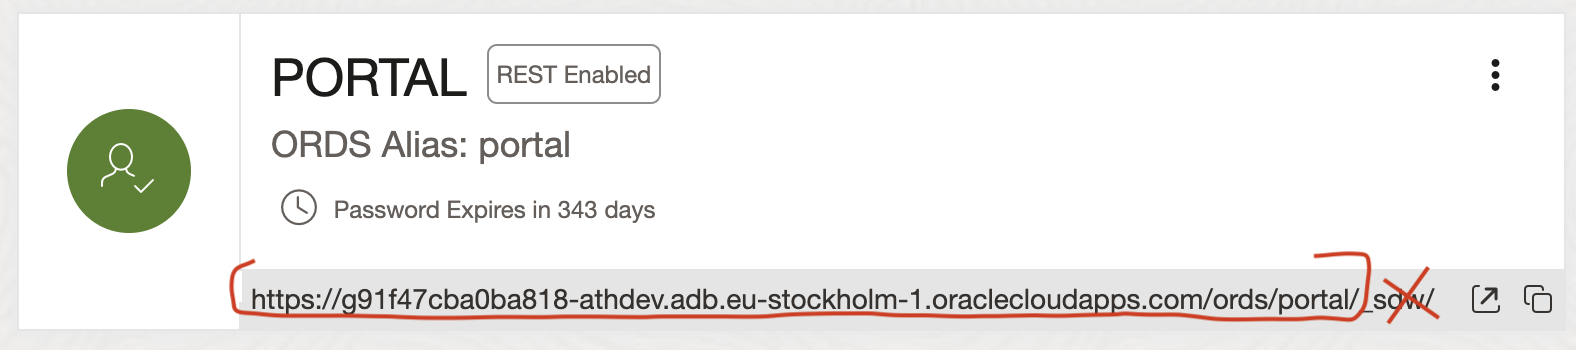
Open Administration > Database users and enable schema you want to log in as REST enabled. And copy the REST URL for this schema, minus the last _sdw/ part.
SQLcl
It is possible to connect to the ORDS SQL endpoint using SQLcl, Jeff Smith blogged about it here. Although not all SQLcl functions are available. For example Liquibase and connection manager are not available.
Here I’m using SQLcl 26.1.
- Start SQLcl with /nolog flag
- CONNECT schemaname@RESTUrl
- Or CONNECT schemaname/password@RESTUrl
ilmarkerm@Ilmars-iMac bin % ./sql /nolog

SQLcl: Release 26.1 Production on Sat Apr 11 09:21:40 2026

Copyright (c) 1982, 2026, Oracle.  All rights reserved.

SQL> connect portal@https://g91f47cba0ba818-athdev.adb.eu-stockholm-1.oraclecloudapps.com/ords/portal/
Password? (**********?) **********************
Connected.

SQL> select user, sys_context('userenv','instance_name');

USER      SYS_CONTEXT('USERENV','INSTANCE_NAME')
_________ _________________________________________
PORTAL    fcehldyf3
I can execute usual SQL commands.
SQL> create table t (id number);

Table T created.

SQL> insert into t (id) values (1);

1 row inserted.

SQL> select * from t;

   ID
_____
    1

SQL> begin
  2    for i in 1..100000 loop
  3      insert into t (id) values (i);
  4    end loop;
  5  end;
  6* /

PL/SQL procedure successfully completed.

SQL> select count(*) from t;

   COUNT(*)
___________
     100001

SQL> truncate table t;

Table T truncated.
But the REST driver is stateless, so no transactions (between different calls – inside the same call they work).
SQL> insert into t (id) values (2000000002);

1 row inserted.

SQL> rollback;

Rollback complete.

SQL> select * from t;

           ID
_____________
   2000000002

SQL> begin
  2  insert into t (id) values (30000003);
  3  rollback;
  4  end;
  5* /

PL/SQL procedure successfully completed.

SQL> select * from t;

           ID
_____________
   2000000002
You cannot use SQLcl connection manager for saving the connections.
SQL> conn -save portaldev portal@https://g91f47cba0ba818-athdev.adb.eu-stockholm-1.oraclecloudapps.com/ords/portal/
Connections of type OREST are not supported for saving
Warning: You are no longer connected to ORACLE.
Also built in Liquibase commands give a NullPointer.
SQL> lb generate-changelog
Null Pointer please log a bug.
liquibase.exception.CommandExecutionException: Cannot invoke "String.toUpperCase()" because the return value of "java.sql.DatabaseMetaData.getSQLKeywords()" is null
GUI
I haven’t been successful at connecting DBeaver nor SQL Developer using the Oracle REST driver. DBeaver just gives a lot of internal JDBC errors even if I strip it down to bare minimum of supported features.
java.lang.NullPointerException: Cannot invoke "java.sql.Statement.execute(String)" because the return value of "org.jkiss.dbeaver.model.impl.jdbc.exec.JDBCStatementImpl.getOriginal()" is nullI’ll leave it like that.
- Written by: ilmarkerm
- Category: Blog entry
- Published: December 7, 2024
This is more of a story type post, motivated by encountering a Linux(?) anomaly that confused me a lot and reaching out to the community for some clarification on the matter. The story is simplified.
It all begins with the fact, that Oracle Linux 7 is at the end of its Premier Support in December 2024. We were planning to just switch out all the hardware (hardware support contracts also expire!) when OL expires and therefore avoid any unnecessary upgrade tasks, but due to the bizarre world of large enterprises the ordering of the new hardware was stalled by business and we now were faced with the fact that the hardware delivery is a year late. And we need to upgrade Oracle Linux on existing hardware – for only 1 year runtime.
This particular system is running Oracle RAC 19.24, Oracle Grid Infrastructure 19.25, Oracle Linux 7 (Oracle Linux 8 on upgraded nodes) – both on 5.4.17 UEK kernels, ASM Filter Driver (AFD) to manage the shared disks. Shared disks come from 4 enterprise storage arrays, connected using FC, all data mirrored on ASM level between different storage arrays (NB! Really important, even expensive under current support enterprise storage arrays fail and their spare part deliveries suffer as time goes on).
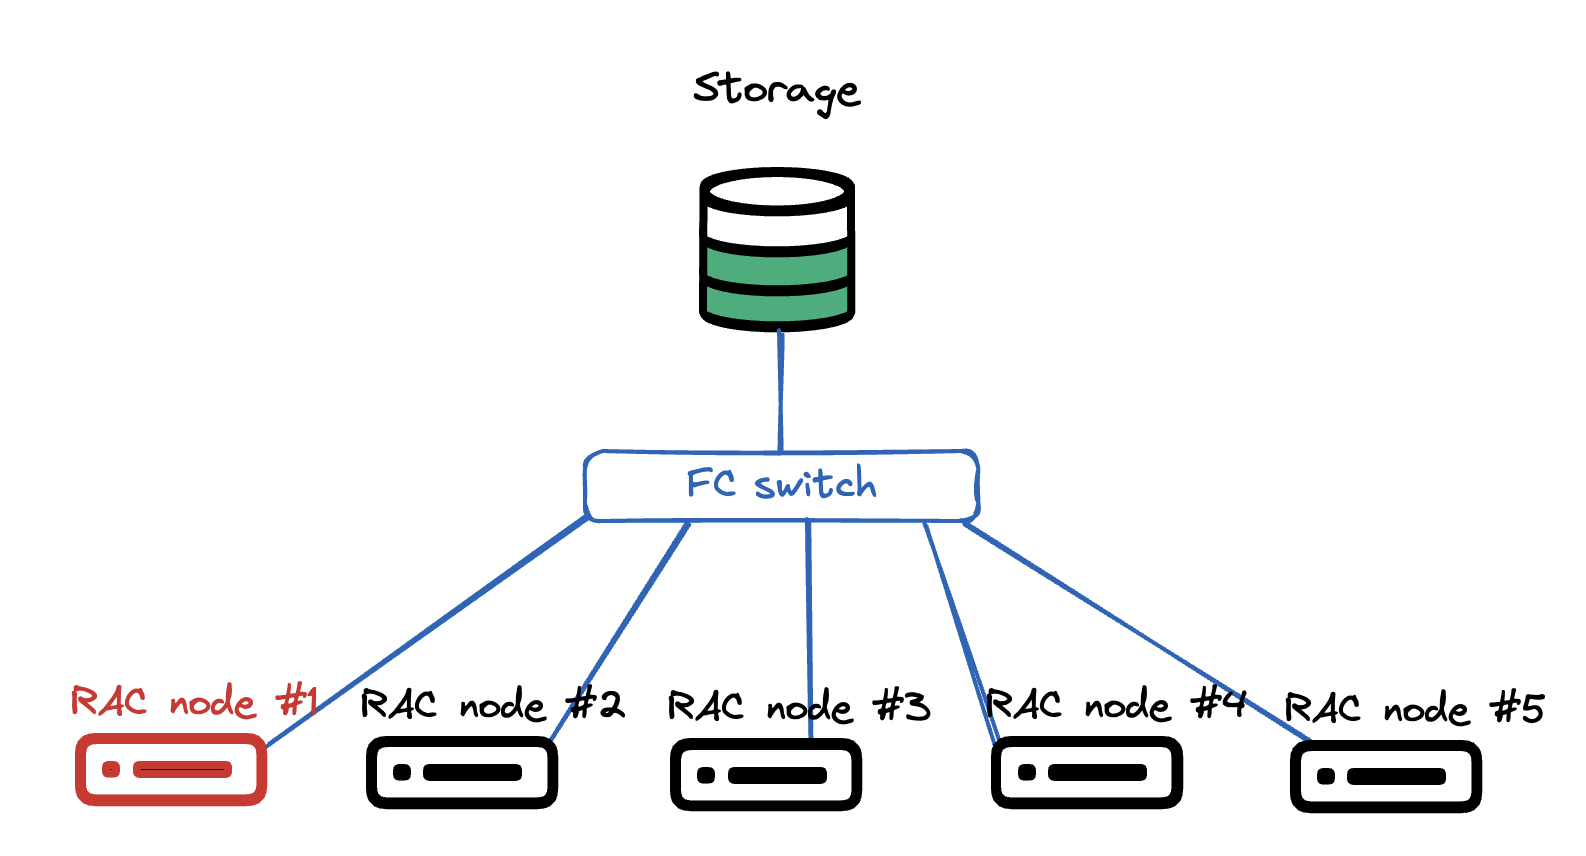
Very simplistic picture how the hardware setup looks like. Multiple compute nodes, all pure hardware, no virtualisation. All connected to the same shared LUNs via fibre channel FC. There is no storage vendor drivers, just pure Linux kernel + multipathd.
OS upgrade plan was very simple:
- Shut down one RAC instance
- Remove the node from cluster
- Disconnect all shared storage
- Install a fresh OS on the node
- Connect all shared storage
- Add the node back to cluster
- Start RAC instance
- Repeat
After I removed the first node from the cluster, handed it over to the sysadmin+storage team, they did the storage disconnect, fresh OS install, connected it back to storage and network. All seemingly well, the RAC database working without issues.
I configure OS for Oracle use, verify all networks and shared LUNs are present, then I run runcluvfy.sh stage -pre nodeadd all good, extend GI software back to new node, run root.sh… and root.sh fails (I don’t have the error message saved).
I start digging in and see that AFD can’t see any shared disks, although AFD is configured and loaded – asmcmd afd_lsdsk output is empty. AFD discovery string is correct, block devices are present in the reinstalled Linux, all looks good, but after repeated afd_scan – nothing (Lucky I didn’t use afd_scan –all).
Just to verify that I can actually read the shared block devices, I used dd to read the first 1M of some of the block devices. I prefer to use fundamental tools for a quick checkup, since they work on more low level and if they show a problem, upper layers will also have issues. Or so I thought.
[production|root@n01 tmp]# dd if=/dev/mapper/36005076810810374d80000000000000a of=/tmp/D1 bs=1M count=1
1+0 records in
1+0 records out
1048576 bytes (1.0 MB) copied, 0.00180256 s, 582 MB/s
I can read the block device just fine. How about the contents? All ASM disks have a header showing the disk name, disk group name and failure groups as plain readable text.
[production|root@n01 tmp]# strings /tmp/D1
EFI PART
What?? That really is not correct. Were the disk headers overwritten?? Lets verify FROM A RUNNING NODE. Here it actually gets interesting.
[production|root@n03 ~]# dd if=/dev/mapper/36005076810810374d80000000000000a of=/tmp/D1 bs=1M count=1
1+0 records in
1+0 records out
1048576 bytes (1.0 MB) copied, 0.00281782 s, 372 MB/s

[production|root@n03 ~]# strings /tmp/D1
ORCLDISKDWDATA_B02IBM304_8
DWDATA_B02IBM304_8
DWDATA
R55B02
READING, with dd, THE SAME DISK ON AN OLD NODE, I SEE THE CORRECT ASM DISK HEADER. This convinced me, assuming dd gives me the correct lowest level info, that the real database disks are fine, but the storage team has messed up the mappings, somehow – although the LUN UUID was the same. And the database was running fine, I didn’t really see any issues in gv$asm_disk.
Storage people started to suspect overwritten headers quite quickly, but I fought back, pointing to other nodes showing the correct headers. To make it even more confusing, also blkid tool showed different results on different nodes – confirming my (flawed) hypothesis that some mappings have been screwed up.
[production|root@n03 ~]# blkid  /dev/mapper/36005076810810374d80000000000000a
/dev/mapper/36005076810810374d80000000000000a: LABEL="DWDATA_B02IBM304_8" TYPE="oracleasm"

[production|root@n02 ~]# blkid  /dev/mapper/36005076810810374d80000000000000a
/dev/mapper/36005076810810374d80000000000000a: PTTYPE="PMBR"

[production|root@n01 ~]# blkid  /dev/mapper/36005076810810374d80000000000000a
/dev/mapper/36005076810810374d80000000000000a: PTTYPE="gpt"
Then we rebooted one instance to see what happens and when it started up – it did not find any AFD disks either and dd is showing damaged disk headers. Then I finally used Oracles own tool for debugging ASM disks – kfed read /dev/mapper/36005076810810374d80000000000000a – on an working instance where dd was still showing correct disk headers – and kfed read also confirmed that the ASM disk header was overwritten – KFBTYP_INVALID.
Time to take out: How To Restore/Repair/Fix An Overwritten (KFBTYP_INVALID) ASM Disk Header (First 4K) 10.2.0.5, 11.1.0.7, 11.2 And Onwards (Doc ID 1088867.1)
That note starts with taking a 50M backup dump, with dd, of each block device and then repairing the ASM disk header using kfed repair (all ASM disks have a backup header at a later part of the disk, which can be restored if still intact).
I quickly took a 50M dump of all block devices FROM ALL NODES – and due to the mismatched information between nodes – still hesitant of actually modifying the disks. So I made a quick and dirty python program to compare the dd dumps of the same block device between different hosts – if they differ only in the first MB or also later (in the data sections) – reporting the differences per “block”.
from pathlib import Path

basedir = Path('/nfs/shared/asmrepair')
compsource = basedir / 'n03_old_node'
compblock = 1024*1024 # 1 MiB
reportok = False

def logmsg(msg:str) -> None:
    print(msg)

# find all directories that are not compsource
compdest = [ d for d in basedir.iterdir() if d.is_dir() and d != compsource ]

# Loop through all files in compsource
for sf in compsource.iterdir():
    if not sf.is_file():
        continue
    logmsg(f"Comparing file {sf.name}")
    for dd in compdest:
        logmsg(f"  Against {dd.name}")
        tf = dd / sf.name
        sfs = sf.stat()
        tfs = tf.stat()
        if sf.name.startswith("blkid_"):
            with sf.open("r") as source, tf.open("r") as target:
                if source.readline() != target.readline():
                    logmsg(f"    LINE DOES NOT MATCH")
                elif reportok:
                    logmsg(f"    LINE ok")
        else:
            if sfs.st_size != tfs.st_size:
                logmsg("    ERROR: Sizes do not match. Should not be here!")
                continue
            if sfs.st_size % compblock != 0:
                logmsg("    ERROR: File size is not in full blocks")
                continue
            # Loop through blocks and compare
            with sf.open("rb") as source, tf.open("rb") as target:
                for blocknum in range(0, int(sfs.st_size/compblock)):
                    if source.read(compblock) != target.read(compblock):
                        logmsg(f"    BLOCK {blocknum} DOES NOT MATCH")
                    elif reportok:
                        logmsg(f"    BLOCK {blocknum} ok")
This did show me that the 50M dumps only differed in the 1M area, and the rest of the contents match up. This gave enough confidence to accept the the disk headers are actually physically overwritten and dd on some nodes is just lying to me, showing some cached information.
kfed repair was able to fix almost all disk headers, and we only lost two disks that showed evidence of GRUB being installed there, so the damage was more extensive than kfed repair could handle. But, since the diskgroups were mirrored on ASM level – and, by luck, the two lost disks belonged to different diskgroups, no data was lost and downtime was very minimal (downtime happened because I tried to rescue voting file to a different shared storage, but this must have triggered afd_scan on ALL instances and cluster lost its voting disks).
It was indeed very confusing that dd lied to me, but one really good outcome from it was that I did still get the old disk headers from some nodes. And since kfed repair requires specifying ausz= parameter, when not using the old default diskgroup AU size of 1M. Since the diskgroups were already planned to be almost 1PiB in size, I ofcourse used a much larger AU size, and did not document it. But kfed read happily interpreted the 50M dd dump files as real ASM disks.
[production|root@n03 grid]# /u00/app/product/19c/bin/kfed read /nfs/shared/asmrepair/n03_old_node/DWDATA_B01IBM301_0|grep au
kfdhdb.ausize:                  8388608 ; 0x0bc: 0x00800000
So the final kfed repair command would be
/u00/app/product/19c/bin/kfed repair /dev/mapper/36005076810810374d80000000000000a ausz=8388608The story is a little more complex, because some not-reinstalled nodes also lost access to 1-2 disks (different disks on different nodes and one node node actually didn’t lose any).
I’m also very surprised that database just kept on working, both ASM and database alert log do report corruptions, but since all instances always had a mirror copy available, uses did not see any errors and the corruptions were repaired.
Ending part
To me the story really shows the resilience of Oracle database and ASM. Yes, the storage+sysadmin people did make a mistake of disconnecting the shared FC LUNs improperly prior OS installation. And then automated OS install wiping all connected disk headers by creating a GPT partition table there.
But in the end no data loss, no need to restore anything from backup – only minimal disruption to the database uptime (due to my attempt to rescue voting files and prevent a cluster crash). And this database is huge, creeping closer to 1PiB mark year by year and refusing to being decommissioned (or shrunk).
But… I would really like to know, why dd did lie to me, showing different disk headers on the same disk on different nodes. It properly confused me. There must be some kernel level caching ot block device headers involved?
And since “dd” and “blkid” can be subject to out-of-date cached information, the proper way do diagnose ASM disk headers is only kfed read.
- Written by: ilmarkerm
- Category: Blog entry
- Published: November 19, 2024
Tested with ORDS 24.3 running using GraalVM 21.
ORDS documentation has a chapter how to push ORDS metrics to OpenTelemetry endpoint, which also is supported by Prometheus. But Prometheus traditionally is using the opposite method, that Prometheus itself will regularly connect to monitored service endpoints and scrape all its metrics. Similar JavaAgent method can also be deployed to expose ORDS metrics as a traditional Prometheus pull based endpoint.
For this we need to deploy Prometheus JMX exporter as a Java agent in ORDS, this will expose /metrics endpoint that Prometheus can scrape.
First, JMX exporter downloads and documentation is available here.
# Download JMX exporter to ORDS host
curl -o jmx_prometheus_javaagent.jar "https://repo1.maven.org/maven2/io/prometheus/jmx/jmx_prometheus_javaagent/1.0.1/jmx_prometheus_javaagent-1.0.1.jar"
Create configuration file, config.yaml with the following contents. It will format the JMX data into more usable Prometheus metric names.
rules:
    # Reformatting Oracle UCP metrics to have more usable names and adding data types
    - pattern: "oracle.ucp.admin.UniversalConnectionPoolMBean<name=.+, poolName=\\|(.+)\\|(.+)\\|.+><>connectionsClosedCount"
      name: oracle_ucp_connectionsClosedCount
      type: COUNTER
      labels:
          poolName: $1_$2
    - pattern: "oracle.ucp.admin.UniversalConnectionPoolMBean<name=.+, poolName=\\|(.+)\\|(.+)\\|.+><>connectionsCreatedCount"
      name: oracle_ucp_connectionsCreatedCount
      type: COUNTER
      labels:
          poolName: $1_$2
    - pattern: "oracle.ucp.admin.UniversalConnectionPoolMBean<name=.+, poolName=\\|(.+)\\|(.+)\\|.+><>cumulative(\\w+)"
      name: oracle_ucp_cumulative$3
      type: COUNTER
      labels:
          poolName: $1_$2
    - pattern: "oracle.ucp.admin.UniversalConnectionPoolMBean<name=.+, poolName=\\|(.+)\\|(.+)\\|.+><>(\\w+)"
      name: oracle_ucp_$3
      type: GAUGE
      labels:
          poolName: $1_$2
    # This pattern below will add all the rest, tons of detailed java internal things
    # Comment out if you do not want to see them
    - pattern: '.*'
I will assume, that jmx_prometheus_javaagent.jar and config.yaml are placed under /home/ords
Next, change ORDS startup script so it would include the JMX agent. The easiest way is to use environment variable _JAVA_OPTIONS for it.
# Set Startup Java options
# 10.10.10.10 is my local server IP where metrics exporter will bind to, default is localhost
# 21022 is the port JMX exporter will listen to
# With this ORDS metrics would be exposed as http://10.10.10.10:21022/metrics

export _JAVA_OPTIONS="-javaagent:/home/ords/jmx_prometheus_javaagent.jar=10.10.10.10:21022:/home/ords/config.yaml"

# Start ORDS in standalone mode as usual
ords serve
Below is my full ORDS SystemD service file – /etc/systemd/system/ords.service
[Unit]
Description=Oracle Rest Data Services
After=syslog.target network.target

[Service]
Type=simple
User=ords
Group=ords
Restart=always
RestartSec=30
Environment="_JAVA_OPTIONS=-Xms3G -Xmx3G -javaagent:/home/ords/jmx_prometheus_javaagent.jar=10.10.10.10:21022:/home/ords/config.yaml"
Environment="JAVA_HOME=/home/ords/graalvm"
#Environment="JAVA_TOOL_OPTIONS=-Djava.util.logging.config.file=/home/ords/logging.conf"
ExecStart=/home/ords/ords/bin/ords --config /etc/ords/config serve --secure --port 8443 --key /etc/ords/server.key --certificate /etc/ords/server.pem

[Install]
WantedBy=multi-user.target
After restarting ORDS I can query its metrics endpoint.
curl http://10.10.10.10:21022/metrics

# You will see many Java and JVM metrics in the output. Example...
jvm_memory_pool_max_bytes{pool="Compressed Class Space"} 1.073741824E9
jvm_memory_pool_max_bytes{pool="G1 Eden Space"} -1.0
jvm_memory_pool_max_bytes{pool="G1 Old Gen"} 3.221225472E9
jvm_memory_pool_max_bytes{pool="G1 Survivor Space"} -1.0
jvm_memory_pool_max_bytes{pool="Metaspace"} -1.0
jvm_memory_pool_used_bytes{pool="CodeHeap 'non-nmethods'"} 1822336.0
jvm_memory_pool_used_bytes{pool="CodeHeap 'non-profiled nmethods'"} 5918080.0
jvm_memory_pool_used_bytes{pool="CodeHeap 'profiled nmethods'"} 2.3397888E7
jvm_memory_pool_used_bytes{pool="Compressed Class Space"} 7328848.0
jvm_memory_pool_used_bytes{pool="G1 Eden Space"} 2.57949696E8
jvm_memory_pool_used_bytes{pool="G1 Old Gen"} 2.280663304E9
jvm_memory_pool_used_bytes{pool="G1 Survivor Space"} 8528.0
jvm_memory_pool_used_bytes{pool="Metaspace"} 6.750048E7
jvm_memory_used_bytes{area="heap"} 2.538621528E9
jvm_memory_used_bytes{area="nonheap"} 1.05967632E8
jvm_threads_deadlocked_monitor 0.0
jvm_threads_peak 62.0
jvm_threads_started_total 62.0
jvm_threads_state{state="BLOCKED"} 0.0
jvm_threads_state{state="NEW"} 0.0
jvm_threads_state{state="RUNNABLE"} 12.0
jvm_threads_state{state="TERMINATED"} 0.0
jvm_threads_state{state="TIMED_WAITING"} 20.0
jvm_threads_state{state="UNKNOWN"} 0.0
jvm_threads_state{state="WAITING"} 15.0

# ORDS database connection pool metrics will be exported like this
# Just an example... all UCP attributes are exported, for all ORDS connection pools

oracle_ucp_abandonedConnectionTimeout{poolName="backoffice_lo"} 0.0
oracle_ucp_abandonedConnectionTimeout{poolName="marketing_communications_2_lo"} 0.0
oracle_ucp_abandonedConnectionsCount{poolName="backoffice_lo"} 0.0
oracle_ucp_abandonedConnectionsCount{poolName="marketing_communications_2_lo"} 0.0
oracle_ucp_availableConnectionsCount{poolName="backoffice_lo"} 10.0
oracle_ucp_availableConnectionsCount{poolName="marketing_communications_2_lo"} 10.0
oracle_ucp_averageBorrowedConnectionsCount{poolName="backoffice_lo"} 1.0
oracle_ucp_averageBorrowedConnectionsCount{poolName="marketing_communications_2_lo"} 1.0
oracle_ucp_averageConnectionWaitTime{poolName="backoffice_lo"} 0.0
oracle_ucp_averageConnectionWaitTime{poolName="marketing_communications_2_lo"} 0.0
oracle_ucp_borrowedConnectionsCount{poolName="backoffice_lo"} 0.0
oracle_ucp_borrowedConnectionsCount{poolName="marketing_communications_2_lo"} 0.0
oracle_ucp_bufferSize{poolName="backoffice_lo"} 1024.0
oracle_ucp_bufferSize{poolName="marketing_communications_2_lo"} 1024.0
oracle_ucp_connectionHarvestMaxCount{poolName="backoffice_lo"} 1.0
oracle_ucp_connectionHarvestMaxCount{poolName="marketing_communications_2_lo"} 1.0
oracle_ucp_connectionHarvestTriggerCount{poolName="backoffice_lo"} 2.147483647E9
oracle_ucp_connectionHarvestTriggerCount{poolName="marketing_communications_2_lo"} 2.147483647E9
oracle_ucp_connectionRepurposeCount{poolName="backoffice_lo"} 0.0
oracle_ucp_connectionRepurposeCount{poolName="marketing_communications_2_lo"} 0.0
oracle_ucp_connectionValidationTimeout{poolName="backoffice_lo"} 15.0
oracle_ucp_connectionValidationTimeout{poolName="marketing_communications_2_lo"} 15.0
oracle_ucp_connectionWaitTimeout{poolName="backoffice_lo"} 3.0
oracle_ucp_connectionWaitTimeout{poolName="marketing_communications_2_lo"} 3.0
oracle_ucp_connectionsClosedCount{poolName="backoffice_lo"} 0.0
oracle_ucp_connectionsClosedCount{poolName="marketing_communications_2_lo"} 0.0
oracle_ucp_connectionsCreatedCount{poolName="backoffice_lo"} 10.0
oracle_ucp_connectionsCreatedCount{poolName="marketing_communications_2_lo"} 10.0
oracle_ucp_createConnectionInBorrowThread{poolName="backoffice_lo"} 1.0
oracle_ucp_createConnectionInBorrowThread{poolName="marketing_communications_2_lo"} 1.0
oracle_ucp_cumulativeConnectionBorrowedCount{poolName="backoffice_lo"} 1.0
oracle_ucp_cumulativeConnectionBorrowedCount{poolName="marketing_communications_2_lo"} 1.0
oracle_ucp_cumulativeConnectionReturnedCount{poolName="backoffice_lo"} 1.0
oracle_ucp_cumulativeConnectionReturnedCount{poolName="marketing_communications_2_lo"} 1.0
oracle_ucp_cumulativeConnectionUseTime{poolName="backoffice_lo"} 60.0
oracle_ucp_cumulativeConnectionUseTime{poolName="marketing_communications_2_lo"} 30.0
oracle_ucp_cumulativeConnectionWaitTime{poolName="backoffice_lo"} 0.0
oracle_ucp_cumulativeConnectionWaitTime{poolName="marketing_communications_2_lo"} 0.0
oracle_ucp_cumulativeFailedConnectionWaitCount{poolName="backoffice_lo"} 0.0
oracle_ucp_cumulativeFailedConnectionWaitCount{poolName="marketing_communications_2_lo"} 0.0
oracle_ucp_cumulativeFailedConnectionWaitTime{poolName="backoffice_lo"} 0.0
oracle_ucp_cumulativeFailedConnectionWaitTime{poolName="marketing_communications_2_lo"} 0.0
oracle_ucp_cumulativeSuccessfulConnectionWaitCount{poolName="backoffice_lo"} 0.0
oracle_ucp_cumulativeSuccessfulConnectionWaitCount{poolName="marketing_communications_2_lo"} 0.0
oracle_ucp_cumulativeSuccessfulConnectionWaitTime{poolName="backoffice_lo"} 0.0
oracle_ucp_cumulativeSuccessfulConnectionWaitTime{poolName="marketing_communications_2_lo"} 0.0
oracle_ucp_failedAffinityBasedBorrowCount{poolName="backoffice_lo"} 0.0
oracle_ucp_failedAffinityBasedBorrowCount{poolName="marketing_communications_2_lo"} 0.0
oracle_ucp_failedRCLBBasedBorrowCount{poolName="backoffice_lo"} 0.0
oracle_ucp_failedRCLBBasedBorrowCount{poolName="marketing_communications_2_lo"} 0.0
oracle_ucp_failoverEnabled{poolName="backoffice_lo"} 0.0
oracle_ucp_failoverEnabled{poolName="marketing_communications_2_lo"} 0.0
oracle_ucp_inactiveConnectionTimeout{poolName="backoffice_lo"} 1800.0
oracle_ucp_inactiveConnectionTimeout{poolName="marketing_communications_2_lo"} 1800.0
oracle_ucp_initialPoolSize{poolName="backoffice_lo"} 10.0
oracle_ucp_initialPoolSize{poolName="marketing_communications_2_lo"} 10.0
oracle_ucp_labeledConnectionsCount{poolName="backoffice_lo"} 0.0
oracle_ucp_labeledConnectionsCount{poolName="marketing_communications_2_lo"} 0.0
oracle_ucp_loggingEnabled{poolName="backoffice_lo"} 0.0
oracle_ucp_loggingEnabled{poolName="marketing_communications_2_lo"} 0.0
oracle_ucp_maxConnectionReuseCount{poolName="backoffice_lo"} 1000.0