Author: ilmarkerm
- Written by: ilmarkerm
- Category: Blog entry
- Published: April 1, 2024
Continuing my series of exploring Oracle Cloud, with the help of Terraform code. You can find the previous post here. I will be referring to resources created in the earlier post.
Object store
Oracle Cloud does provide S3 style Object Storage, that is just called Buckets. Buckets can also speak S3 protocol, so they are usable for applications that speak S3.
One difference from AWS S3 is that in Oracle Buckets the storage class/tier is not at the object level, you have to specify during the creation of the Bucket if it is at the Standard or Archive tier.
Here I create two Buckets, one in standard tier and one archival.
# object_storage.tf

data "oci_objectstorage_namespace" "user_namespace" {
    compartment_id = oci_identity_compartment.compartment.id
}

resource "oci_objectstorage_bucket" "standard_bucket" {
    # Referencing compartment from earlier
    compartment_id = oci_identity_compartment.compartment.id
    name = "my-standard-tier-bucket"
    namespace = data.oci_objectstorage_namespace.user_namespace.namespace
    access_type = "NoPublicAccess"
    auto_tiering = "Disabled"
    object_events_enabled = true
    versioning = "Enabled"
    storage_tier = "Standard"
}

resource "oci_objectstorage_bucket" "archive_bucket" {
    # Referencing compartment from earlier
    compartment_id = oci_identity_compartment.compartment.id
    name = "my-archival-bucket"
    namespace = data.oci_objectstorage_namespace.user_namespace.namespace
    access_type = "NoPublicAccess"
    auto_tiering = "Disabled"
    object_events_enabled = false
    versioning = "Disabled"
    storage_tier = "Archive"
}
And also adding some lifecycle policies. One to abort multipart uploads that have not finished in days and also one policy to delete old object versions.
# object_storage.tf

# Bucket lifecycle policies

resource "oci_objectstorage_object_lifecycle_policy" "standard_bucket" {
    bucket = oci_objectstorage_bucket.standard_bucket.name
    namespace = data.oci_objectstorage_namespace.user_namespace.namespace

    rules {
        action = "ABORT"
        is_enabled = true
        name = "delete-uncommitted-multipart-uploads"
        target = "multipart-uploads"
        time_amount = 2
        time_unit = "DAYS"
    }
    rules {
        action = "DELETE"
        is_enabled = true
        name = "delete-old-versions"
        target = "previous-object-versions"
        time_amount = 60
        time_unit = "DAYS"
    }
}

resource "oci_objectstorage_object_lifecycle_policy" "archive_bucket" {
    bucket = oci_objectstorage_bucket.archive_bucket.name
    namespace = data.oci_objectstorage_namespace.user_namespace.namespace

    rules {
        action = "ABORT"
        is_enabled = true
        name = "delete-uncommitted-multipart-uploads"
        target = "multipart-uploads"
        time_amount = 2
        time_unit = "DAYS"
    }
}
Block storage
A very good improvement over AWS is that in Oracle Cloud you can define declarative backup policies for block storage used in your compute instances. They are automatic snapshots, that are also cleaned up automatically after the retention period has expired. Lets start with that and define a backup policy that is executed every day at 0:00 UTC and kept for 60 days.
# block_storage.tf

resource "oci_core_volume_backup_policy" "test_policy" {
    compartment_id = oci_identity_compartment.compartment.id
    display_name = "Block storage backup policy for testing"
    schedules {
        backup_type = "INCREMENTAL"
        period = "ONE_DAY"
        hour_of_day = 1
        time_zone = "UTC"
        # Keep backups for 60 days
        retention_seconds = 3600*24*60
    }
}
There are also some backup policies already defined by Oracle. Sadly you cannot specify in data resource the name of the policy you want to address, so some array magic is needed when using it later.
# block_storage.tf

data "oci_core_volume_backup_policies" "oracle_defined" {}

# For examining the output
output "oracle_defined_volume_backup_policies" {
    value = data.oci_core_volume_backup_policies.oracle_defined
}
Now lets create some block storage volumes. First volume is the cheapest, lowest performance; and the second volume is using balanced performance profile.
# block_storage.tf

resource "oci_core_volume" "test_volume" {
    compartment_id = oci_identity_compartment.compartment.id
    # List availability domains
    # oci iam availability-domain list
    availability_domain = "MpAX:EU-STOCKHOLM-1-AD-1"
    is_auto_tune_enabled = false
    size_in_gbs = 50
    # vpus_per_gb = 0 - low cost option
    vpus_per_gb = 0
}

resource "oci_core_volume" "silver_test_volume" {
    compartment_id = oci_identity_compartment.compartment.id
    # List availability domains
    # oci iam availability-domain list
    availability_domain = "MpAX:EU-STOCKHOLM-1-AD-1"
    is_auto_tune_enabled = false
    size_in_gbs = 50
    # vpus_per_gb = 10 - balanced performance option
    vpus_per_gb = 10
}
And lets attach the volumes to their backup policies. First volume the the policy I created earlier and the second volume to Oracle defined backup policy.
resource "oci_core_volume_backup_policy_assignment" "test_volume" {
    asset_id = oci_core_volume.test_volume.id
    # Attach to user defined policy
    policy_id = oci_core_volume_backup_policy.test_policy.id
}

resource "oci_core_volume_backup_policy_assignment" "silver_test_volume" {
    asset_id = oci_core_volume.silver_test_volume.id
    # Attach to Silver policy
    policy_id = data.oci_core_volume_backup_policies.oracle_defined.volume_backup_policies[1].id
}- Written by: ilmarkerm
- Category: Blog entry
- Published: March 24, 2024
I thought I’ll start exploring Oracle Cloud offerings a little and try building something with Terraform.
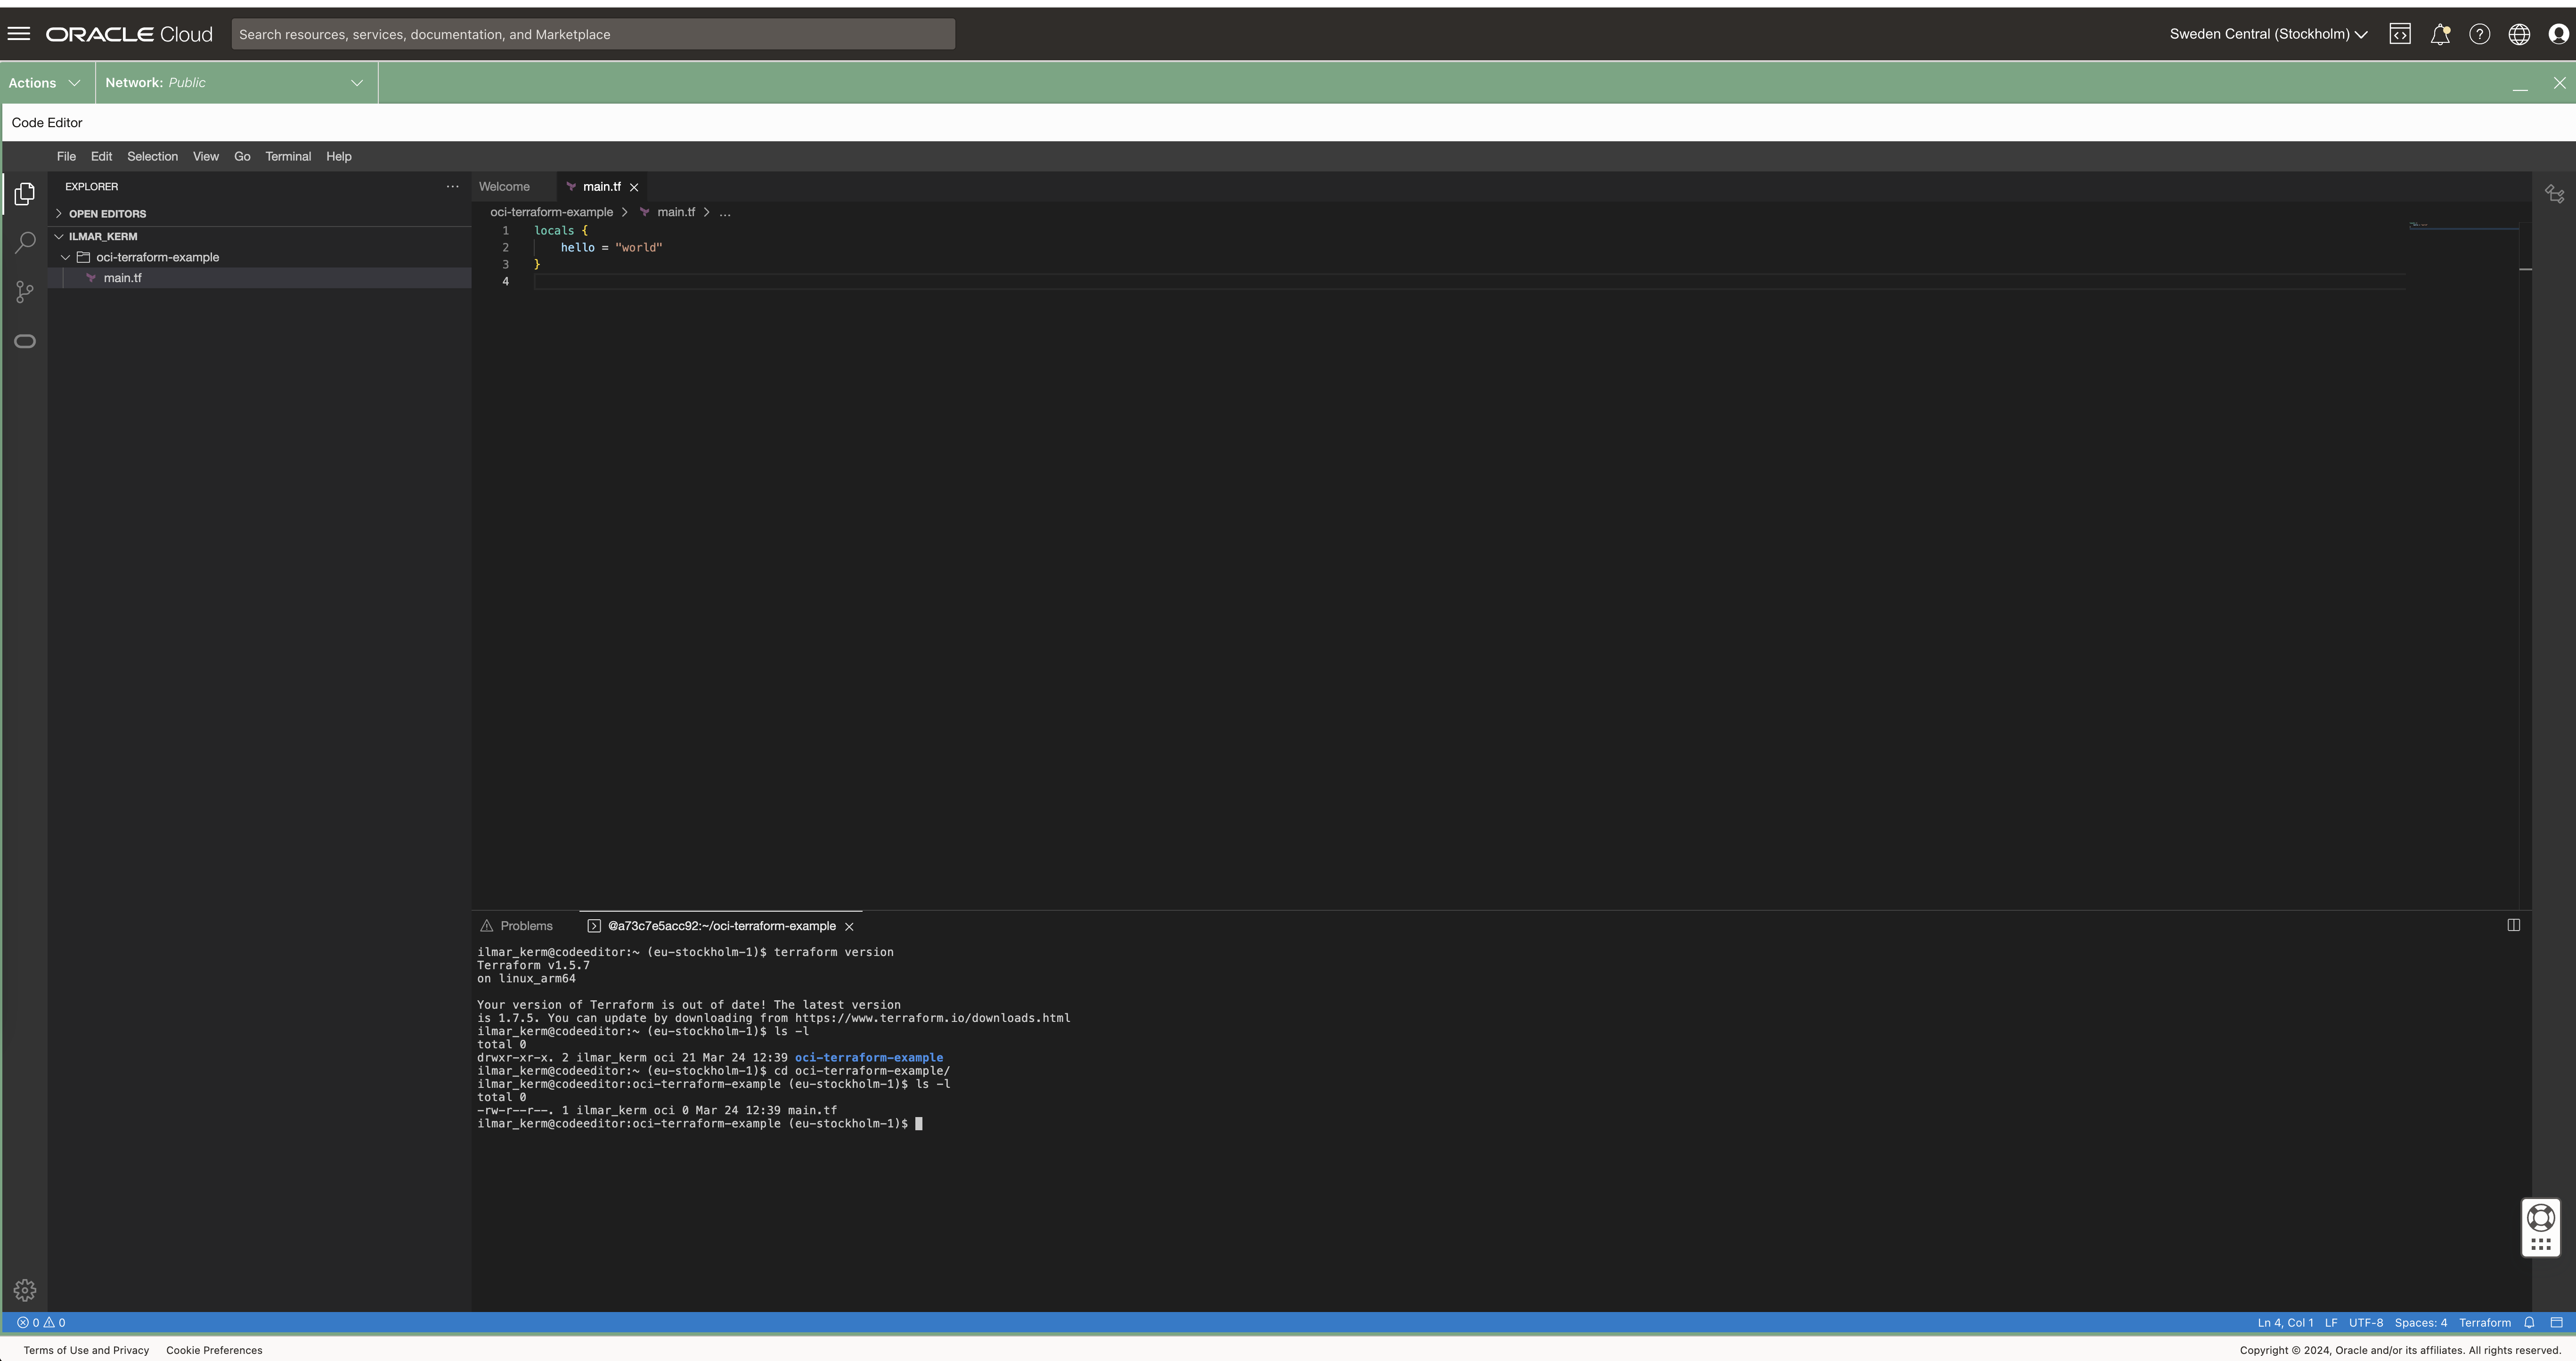
The execution environment
OCI Could Console offers Cloud Shell and Code Editor right from the browser. Cloud Shell is a small Oracle Linux container with shell access, that has the most popular cloud tools and OCI SDKs already deployed. Most importantly, however, all Oracle Cloud API commands you execute from there, they run silently as yourself, no additional setup required. Including setting up terraform. Pretty awesome idea I would say – no need to set up any admin computer first.
Since I would mainly write code, I’m going to use only only Code Editor (which is actually VS Code in your browser) and VS Code also has a built in terminal for executing commands.
Read about executing and using Cloud Shell here.
Setting up Terraform provider
When executing from Cloud Shell / Code Editor, then setting up the terraform provider is very simple.
# versions.tf

provider "oci" {
   region = "eu-stockholm-1"
}
It is very good practice to also place terraform state file in the shared object store. OCI also provides an object store and to set it up first create a Bucket in Object Storage.
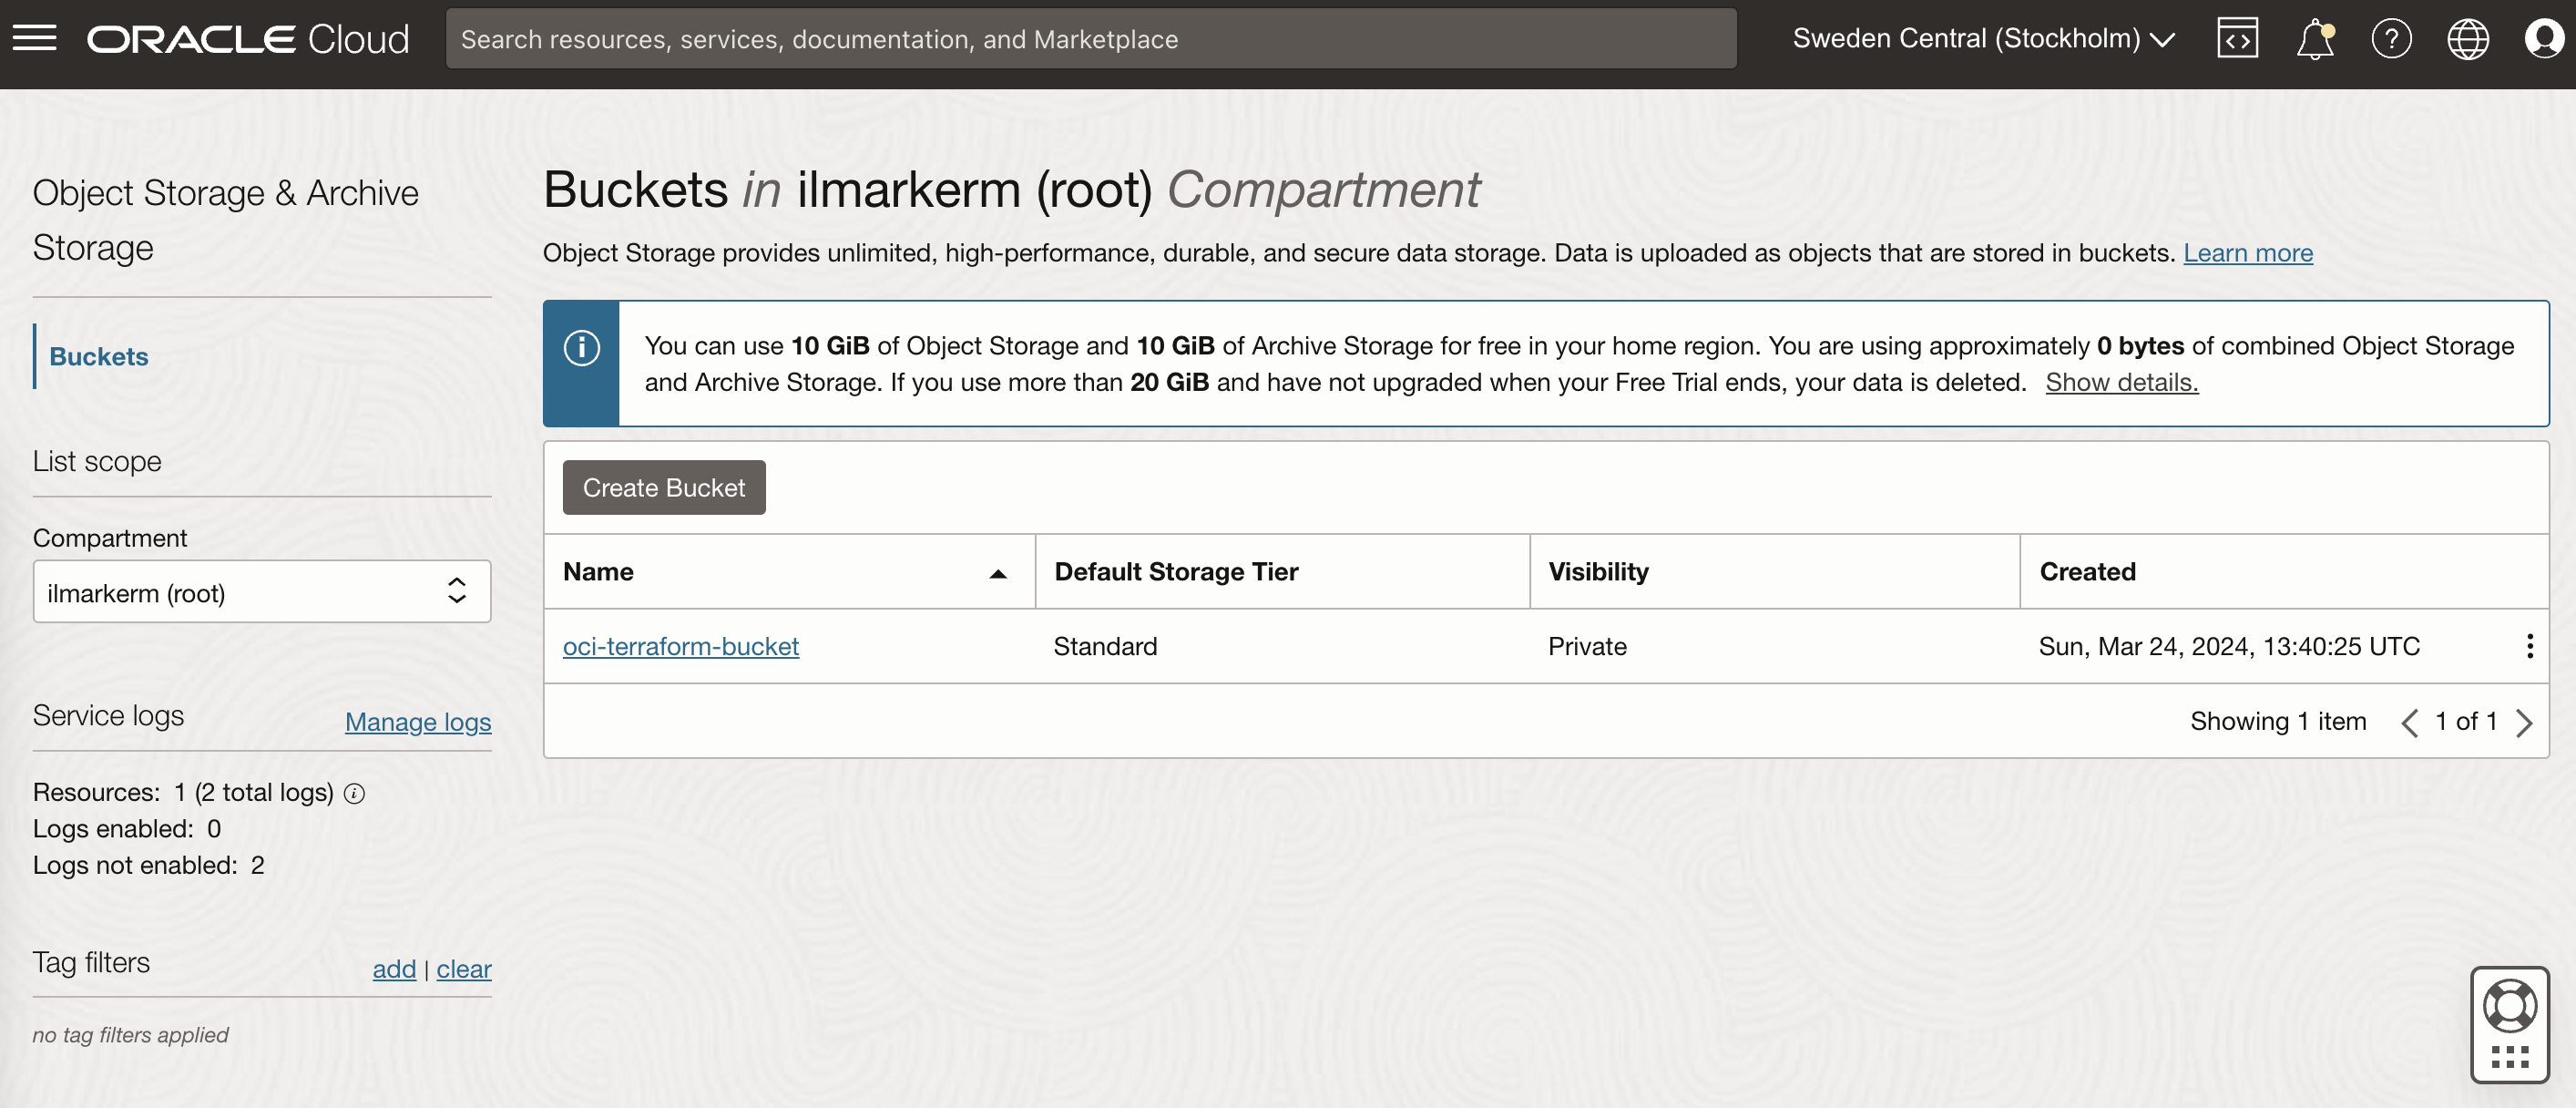
This also requires setting up Customer Secret Keys, for accessing the bucket using S3 protocol. I’m going to save my access key and secret access key in a file named bucket.credentials.
# bucket.credentials

[default]
aws_access_key_id=here is your access key
aws_secret_access_key=here is your secret access key


# remote_state.tf

terraform {
    backend "s3" {
        bucket = "oci-terraform-bucket"
        key    = "oci-terraform.tfstate"
        region = "eu-stockholm-1"
        # ax9u97qgbo5h is the namespace of the bucket, it is shown in the Bucket Details page
        endpoint = "https://ax9u97qgbo5h.compat.objectstorage.eu-stockholm-1.oraclecloud.com"
        shared_credentials_file     = "bucket.credentials"
        skip_region_validation      = true
        skip_credentials_validation = true
        skip_metadata_api_check     = true
        force_path_style            = true
    }
}
Creating compartment and basic networking
Compartment is just a handy hierarchical logical container which helps to organise your Oracle Cloud resources better. It can also be used to set common tags for all resources created under it.
# main.tf
locals {
tenancy_id = "ocid1.tenancy.oc1..aaaaaaaawf2fv3ipfdp564ffiqpfqr6u6n3uofydgtihq3wget5357lq5i6a"
environment = "dev"
}
# Information about current tenancy, for example home region
data "oci_identity_tenancy" "tenancy" {
tenancy_id = local.tenancy_id
}
# Get the parent compartment as a terraform object
data "oci_identity_compartment" "parent_compartment" {
# Top get list of existing compartments execute:
# oci iam compartment list
id = data.oci_identity_tenancy.tenancy.id
}
# Create compartment
resource "oci_identity_compartment" "compartment" {
# Compartment_id must be the parent compartment ID and it is required
compartment_id = data.oci_identity_compartment.parent_compartment.id
description = "oci-terraform experiments"
name = "oci-terraform-experiments"
# Define some default tags that are added to all resources created under this compartment
freeform_tags = {
"deployed_by" = "terraform"
"environment" = local.environment
}
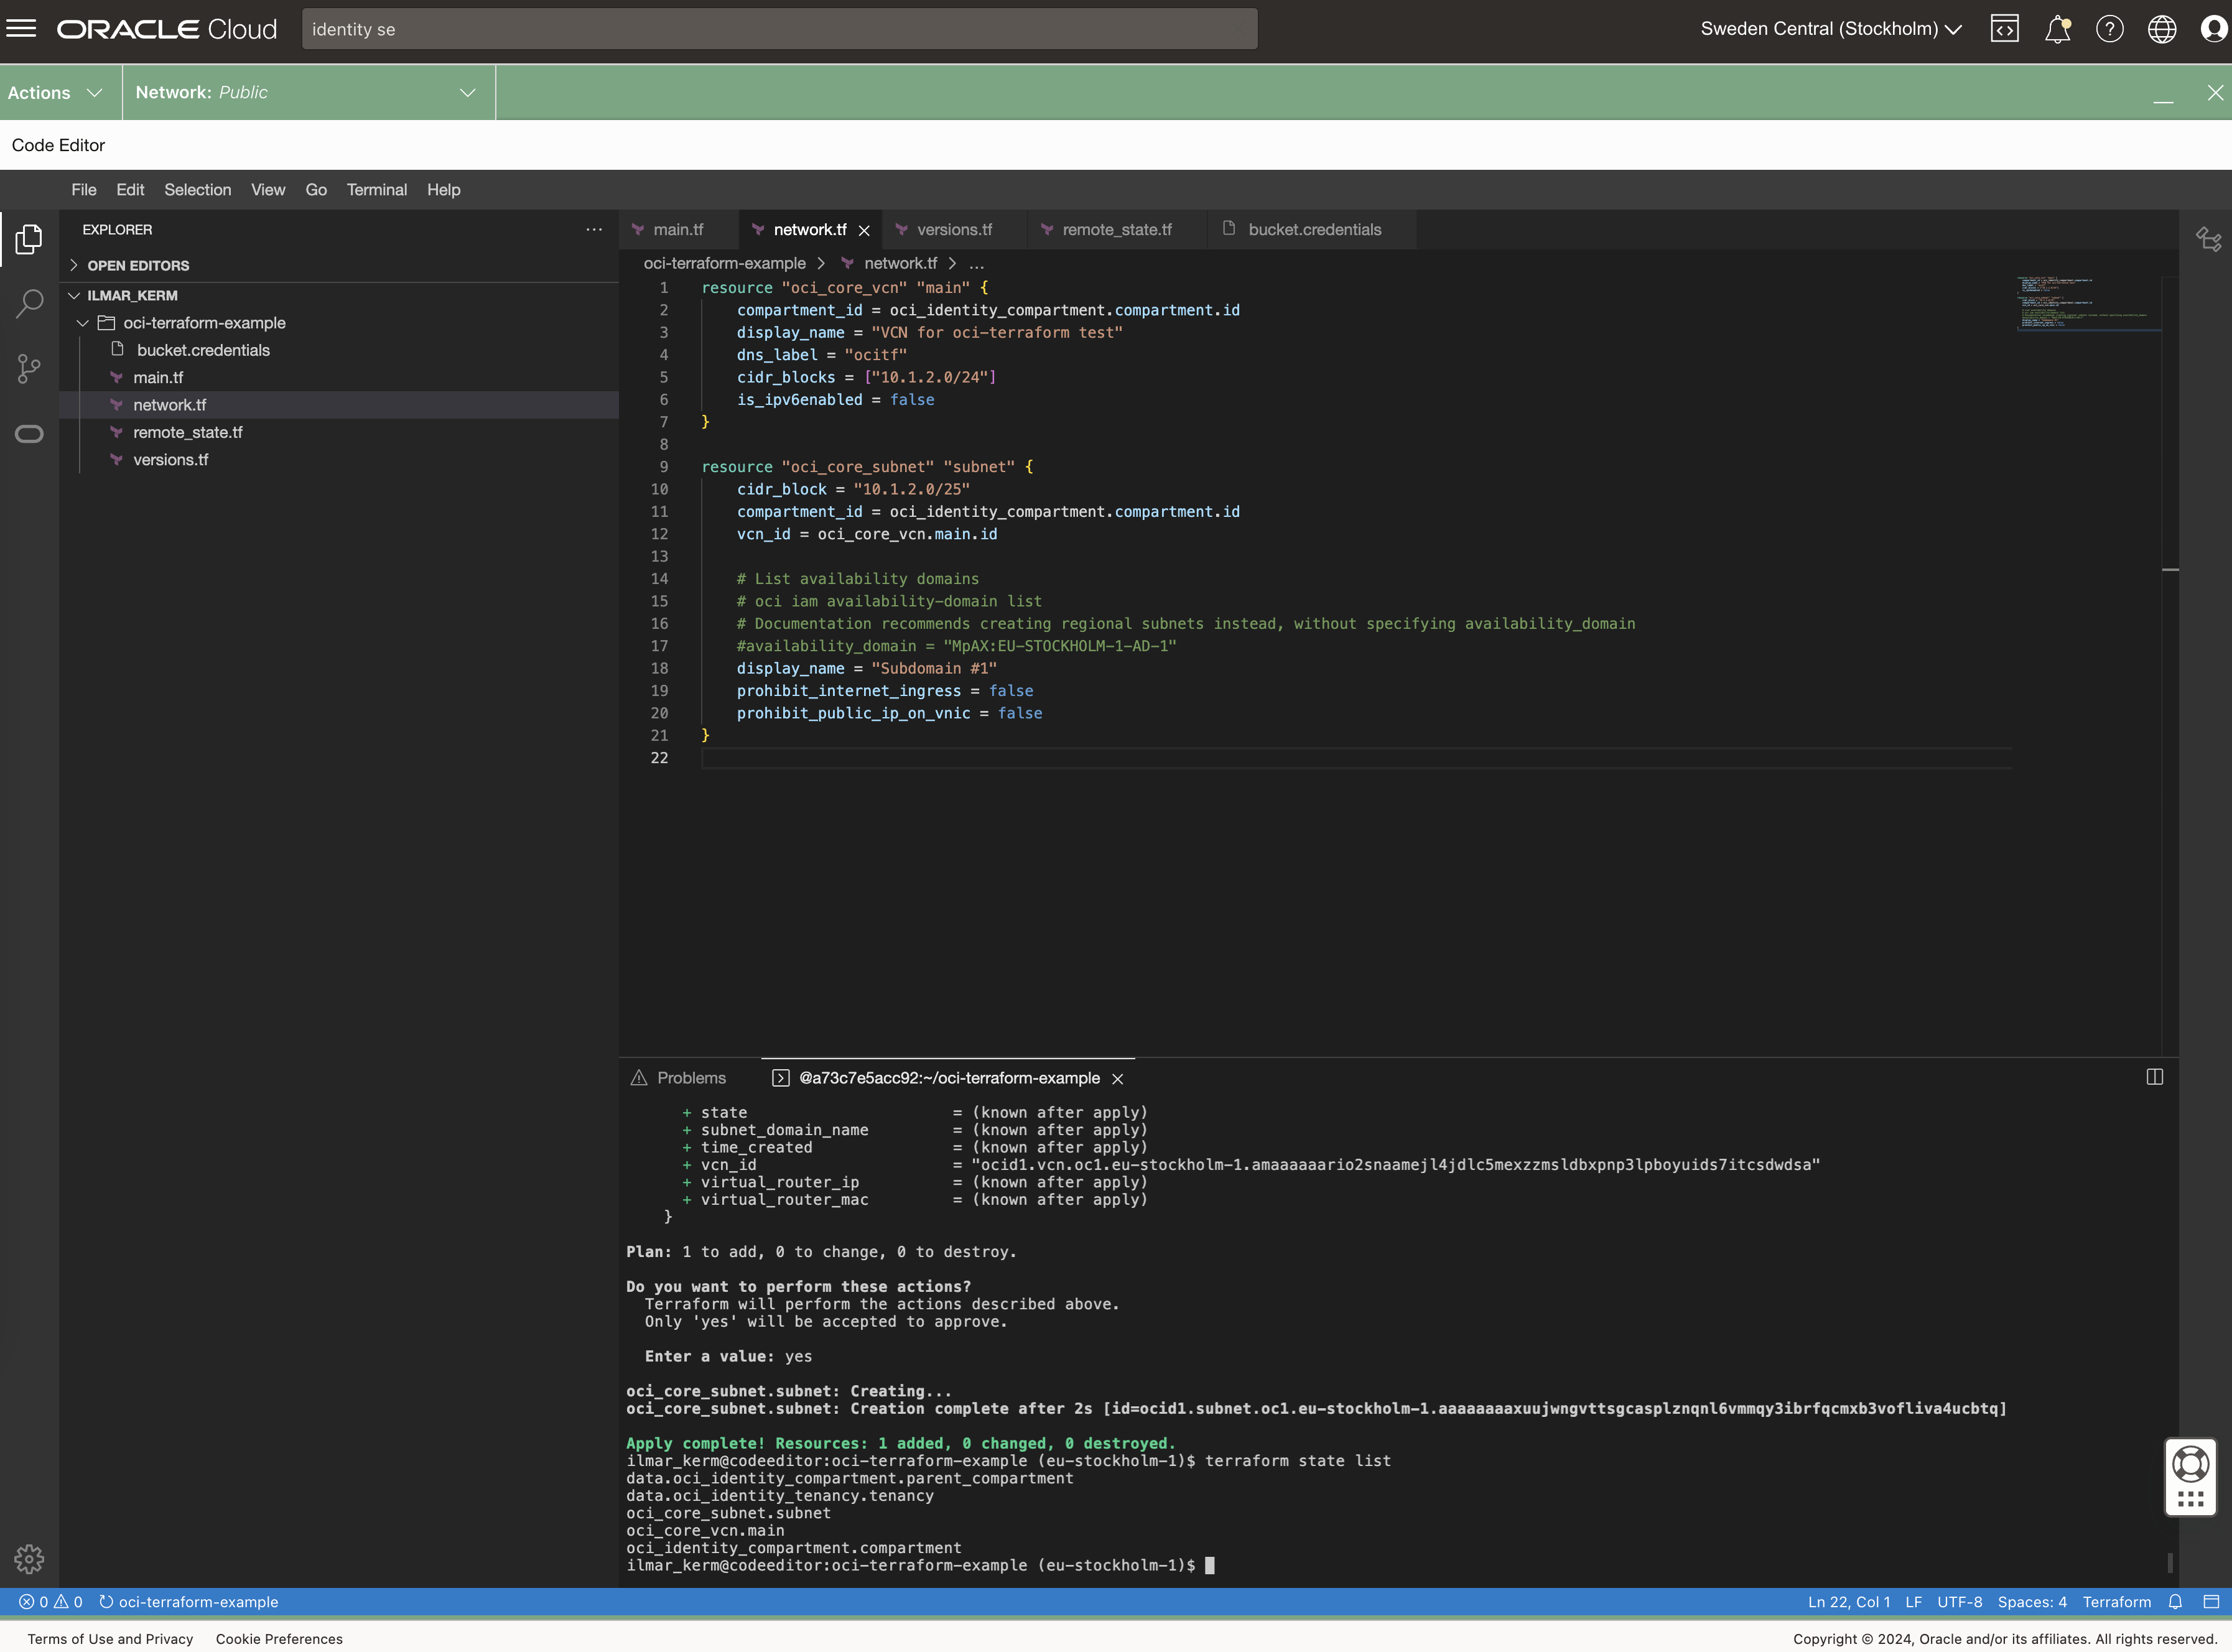
}To set up networking, first you need VCN Virtual Cloud Network and under it subnets.
# network.tf

resource "oci_core_vcn" "main" {
    compartment_id = oci_identity_compartment.compartment.id
    display_name = "VCN for oci-terraform test"
    dns_label = "ocitf"
    cidr_blocks = ["10.1.2.0/24"]
    is_ipv6enabled = false
}

resource "oci_core_subnet" "subnet" {
    cidr_block = "10.1.2.0/25"
    compartment_id = oci_identity_compartment.compartment.id
    vcn_id = oci_core_vcn.main.id

    # List availability domains
    # oci iam availability-domain list
    # Documentation recommends creating regional subnets instead, without specifying availability_domain
    #availability_domain = "MpAX:EU-STOCKHOLM-1-AD-1"
    display_name = "Subdomain #1"
    prohibit_internet_ingress = false
    prohibit_public_ip_on_vnic = false
}
To be continued
I don’t really know where this post series is going. I’ve done quite a bit of Terraforming in AWS, so here I’m just exporing what Oracle Cloud has to offer and instead of using the dreaded ClickOps, I’ll try to be proper with Terraform.
At the end of the post I have these resources created.
Efficient test database refresh using Data Guard Snapshot Standby, Multitenant and storage snapshots
- Written by: ilmarkerm
- Category: Blog entry
- Published: March 23, 2024
There are many different ways to refresh test database with production data. Here I’m going to describe another one, that might be more on the complex side, but the basic requirements I had are:
- Data must be cleaned before opening it up for testing. Cleaning process is extensive and usually takes a few days to run.
- Switching testing from old copy to a new copy must be relatively fast. Also if problems are discovered, we should be able to switch back to the old copy relatively fast.
- Databases are large, hundreds of terabytes, so any kind of data copy over network (like PDB cloning over database link) would take unacceptable amount of time and resources.
- There is no network connection between test database network and production database network, so PDB cloning over database link is not possible anyway.
- The system should work also with databases that have a Data Guard standby with Fast-Start Failover configured.
Any kind of copying the data will not work, since the databases are really large – so some kind of storage level snapshot is needed – and we can use a modern NAS system (that databases utilise over NFS) that can do snapshots and thin clones. Although not in multiple layers.
Here is one attempt to draw out the system. With a more complicated case where the test database actually has two database instances, in Data Guard Fast-Start Failover mode.
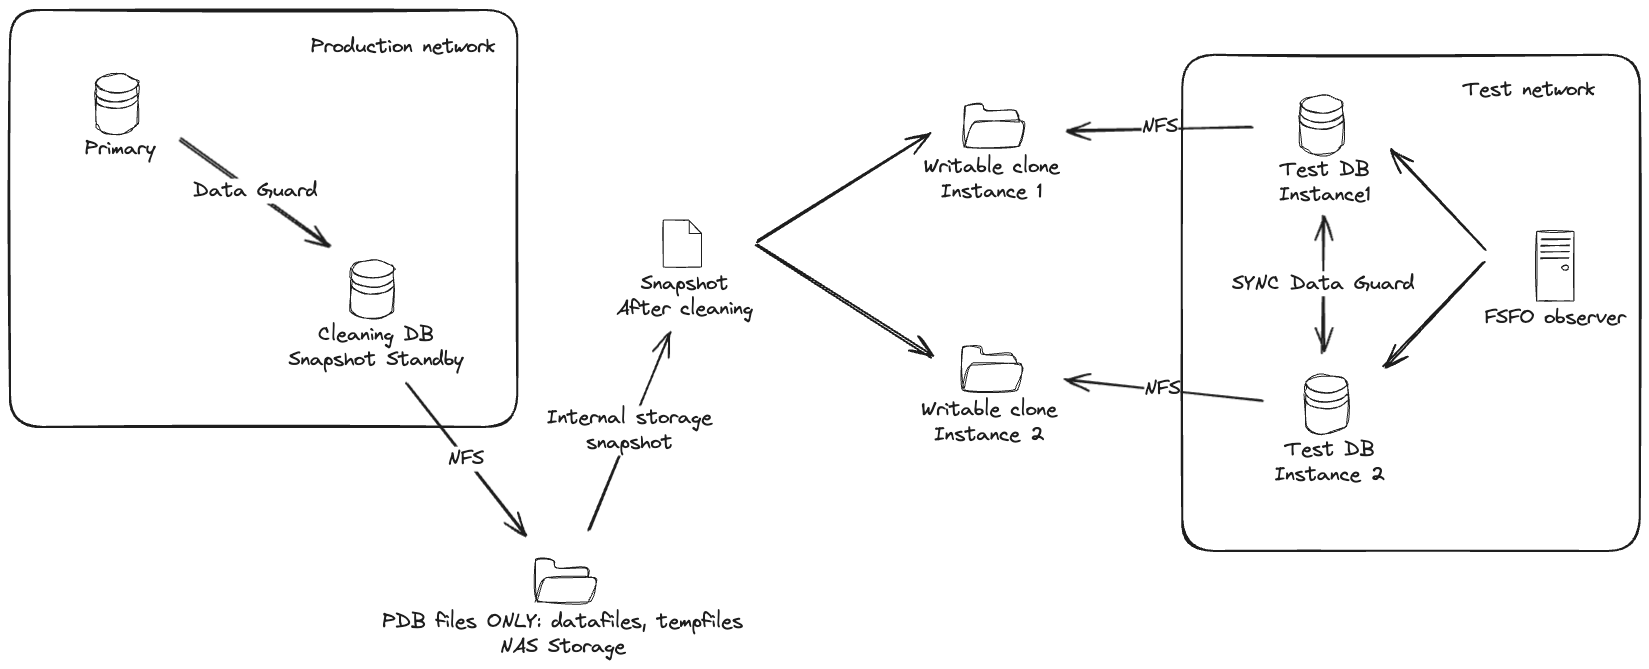
Basically:
- There is a special Data Guard standby for the cleaning process. This standby is using an external NAS storage for storing all PDB datafiles and tempfiles. No CDB files, like CDB datafiles, online logs, standby logs or recovery area should be stored in that NAS folder – keep CDB files separate.
- To start the cleaning process, put the cleaning standby in Snapshot Standby mode (instructions are here) and run all cleaning processes and scripts on the snapshot standby. After cleaning is finished successfully, create PDB metadata XML files and shut down the snapshot standby.
- Create storage level snapshot of the NAS folder storing the PDB files.
- Restore Snapshot Standby back to being a normal physical standby.
- Create writable clone from the same storage snapshot for the test database. If the test database consists of more Data Guard databases, then create a clone (from the same snapshot) for each one of them and mount them to the test database hosts.
- On the test database create a new pluggable database as clone (using NOCOPY to avoid any data movement). In case of Data Guard, do not forget to set standby_pdb_source_file_directory so the standby database would know where to find the data files of the plugged in database.
Done. Currently both old and new copy are attached to the same test CDB as independent PDBs, when you are happy with the new copy, just direct testing traffic to the new PDB. Then old one is not needed, drop it and clean up the filesystems.
Sounds maybe too complex, but the whole point is to avoid moving around large amounts of data. And key part of support rapid switching to the new copy and supporting Data Guard setups (on the test environment side) is keeping the test database CDB intact.
The steps
I have a post about using Snapshot Standby, you can read it here. All the code below is for the experts…
The preparation
Big part of the system is preparing the Cleaning DB that will be used for Snapshot Database.
Here I use the following paths:
- /oradata – Location for standby database CDB files, online logs, standby logs, recovery area
- /nfs/pdb – NFS folder from external NAS, that will ONLY store all PDB datafiles and tempfiles
# Parameters
NAME                                 TYPE        VALUE
------------------------------------ ----------- ------------------------------
db_create_file_dest                  string      /nfs/pdb
db_create_online_log_dest_1          string      /oradata
db_recovery_file_dest                string      /oradata
db_recovery_file_dest_size           big integer 10T

# Datafiles
    CON_ID NAME
---------- --------------------------------------------------------------------------------------------------------------------------
         1 /oradata/PROD1MT101CL/datafile/o1_mf_audit_tb__0d68332o_.dbf
         1 /oradata/PROD1MT101CL/datafile/o1_mf_sysaux__0d5fjj5y_.dbf
         1 /oradata/PROD1MT101CL/datafile/o1_mf_system__0d4zdst4_.dbf
         1 /oradata/PROD1MT101CL/datafile/o1_mf_undotbs1__0d5yw58n_.dbf
         1 /oradata/PROD1MT101CL/datafile/o1_mf_users__0d65hljg_.dbf
         2 /oradata/PROD1MT101CL/C24DD111D3215498E0536105500AAC63/datafile/data_D-WI93OP21_I-1717445842_TS-SYSAUX_FNO-4_q92k3val
         2 /oradata/PROD1MT101CL/C24DD111D3215498E0536105500AAC63/datafile/data_D-WI93OP21_I-1717445842_TS-SYSTEM_FNO-2_p32k3v89
         2 /oradata/PROD1MT101CL/C24DD111D3215498E0536105500AAC63/datafile/data_D-WI93OP21_I-1717445842_TS-UNDOTBS1_FNO-6_q22k3vag
         3 /nfs/pdb/PROD1MT101CL/CC1BE00B92E672FFE053F905500A1BAE/datafile/o1_mf_audit_tb__0fbbwglb_.dbf
         4 /nfs/pdb/PROD1MT101CL/C2811CAFC29D1DC9E053F905500A7EC9/datafile/o1_mf_audit_tb__0fk2wkxy_.dbf
         4 /nfs/pdb/PROD1MT101CL/C2811CAFC29D1DC9E053F905500A7EC9/datafile/o1_mf_users__0fj4hm5h_.dbf
         5 /nfs/pdb/PROD1MT101CL/CF6A94E61EF92940E053F905500AFB8E/datafile/o1_mf_audit_tb__0fsslsvv_.dbf
         5 /nfs/pdb/PROD1MT101CL/CF6A94E61EF92940E053F905500AFB8E/datafile/o1_mf_users__0frm1yg5_.dbf
         6 /nfs/pdb/PROD1MT101CL/CF6A94E61F3E2940E053F905500AFB8E/datafile/o1_mf_audit_tb__0fz8nq60_.dbf
         6 /nfs/pdb/PROD1MT101CL/CF6A94E61F3E2940E053F905500AFB8E/datafile/o1_mf_users__0fy4j81x_.dbf
         7 /nfs/pdb/PROD1MT101CL/CF6A94E61F832940E053F905500AFB8E/datafile/o1_mf_audit_tb__0f46dfvs_.dbf
         7 /nfs/pdb/PROD1MT101CL/CF6A94E61F832940E053F905500AFB8E/datafile/o1_mf_users__0f3cn007_.dbf
         8 /nfs/pdb/PROD1MT101CL/CF6A94E61FC82940E053F905500AFB8E/datafile/o1_mf_audit_tb__0g5h842b_.dbf
         8 /nfs/pdb/PROD1MT101CL/CF6A94E61FC82940E053F905500AFB8E/datafile/o1_mf_users__0g2v64l9_.dbf
         9 /nfs/pdb/PROD1MT101CL/05126406D61853B3E0635005500AA12B/datafile/o1_mf_audit_tb__0g9rsqpo_.dbf
         9 /nfs/pdb/PROD1MT101CL/05126406D61853B3E0635005500AA12B/datafile/o1_mf_inmemory__0g8yrdvh_.dbf

# Tempfiles
    CON_ID NAME
---------- -------------------------------------------------------------------------------------------------
         1 /oradata/PROD1MT101CL/datafile/o1_mf_temp__0d35c01p_.tmp
         2 /oradata/PROD1MT101CL/C24DD111D3215498E0536105500AAC63/datafile/o1_mf_temp__0d36q7dx_.tmp
         3 /nfs/pdb/PROD1MT101CL/CC1BE00B92E672FFE053F905500A1BAE/datafile/o1_mf_temp__0gr02w4t_.tmp
         3 /nfs/pdb/PROD1MT101CL/CC1BE00B92E672FFE053F905500A1BAE/datafile/o1_mf_temp__0gr0j0wr_.tmp
         3 /nfs/pdb/PROD1MT101CL/CC1BE00B92E672FFE053F905500A1BAE/datafile/o1_mf_temp_dba__0gqzydts_.tmp
         4 /nfs/pdb/PROD1MT101CL/C2811CAFC29D1DC9E053F905500A7EC9/datafile/o1_mf_temp__0grhwybg_.tmp
         4 /nfs/pdb/PROD1MT101CL/C2811CAFC29D1DC9E053F905500A7EC9/datafile/o1_mf_temp__0grjcvk4_.tmp
         4 /nfs/pdb/PROD1MT101CL/C2811CAFC29D1DC9E053F905500A7EC9/datafile/o1_mf_temp_dba__0h6slfch_.tmp
         5 /nfs/pdb/PROD1MT101CL/CF6A94E61EF92940E053F905500AFB8E/datafile/o1_mf_temp__0gokwd9n_.tmp
         5 /nfs/pdb/PROD1MT101CL/CF6A94E61EF92940E053F905500AFB8E/datafile/o1_mf_temp__0gol9jc6_.tmp
         5 /nfs/pdb/PROD1MT101CL/CF6A94E61EF92940E053F905500AFB8E/datafile/o1_mf_temp_dba__0gokr9ng_.tmp
         6 /nfs/pdb/PROD1MT101CL/CF6A94E61F3E2940E053F905500AFB8E/datafile/o1_mf_temp__0gnrh7x8_.tmp
         6 /nfs/pdb/PROD1MT101CL/CF6A94E61F3E2940E053F905500AFB8E/datafile/o1_mf_temp__0gnrw0dj_.tmp
         6 /nfs/pdb/PROD1MT101CL/CF6A94E61F3E2940E053F905500AFB8E/datafile/o1_mf_temp_dba__0gnrb2gg_.tmp
         7 /nfs/pdb/PROD1MT101CL/CF6A94E61F832940E053F905500AFB8E/datafile/o1_mf_temp__0gmw72co_.tmp
         7 /nfs/pdb/PROD1MT101CL/CF6A94E61F832940E053F905500AFB8E/datafile/o1_mf_temp__0gmwnqsp_.tmp
         7 /nfs/pdb/PROD1MT101CL/CF6A94E61F832940E053F905500AFB8E/datafile/o1_mf_temp_dba__0gmw1xm3_.tmp
         8 /nfs/pdb/PROD1MT101CL/CF6A94E61FC82940E053F905500AFB8E/datafile/o1_mf_temp__0gm118wt_.tmp
         8 /nfs/pdb/PROD1MT101CL/CF6A94E61FC82940E053F905500AFB8E/datafile/o1_mf_temp__0gm1dv5n_.tmp
         8 /nfs/pdb/PROD1MT101CL/CF6A94E61FC82940E053F905500AFB8E/datafile/o1_mf_temp_dba__0gm0wzcc_.tmp
         9 /nfs/pdb/PROD1MT101CL/05126406D61853B3E0635005500AA12B/datafile/o1_mf_temp__0gj66tgb_.tmp
         9 /nfs/pdb/PROD1MT101CL/05126406D61853B3E0635005500AA12B/datafile/o1_mf_temp_dba__0gh7wbpf_.tmp

# Logs
MEMBER
--------------------------------------------------------
/oradata/PROD1MT101CL/onlinelog/o1_mf_1__0b0frl6b_.log
/oradata/PROD1MT101CL/onlinelog/o1_mf_2__0b1qco5j_.log
/oradata/PROD1MT101CL/onlinelog/o1_mf_3__0b2bd0od_.log
/oradata/PROD1MT101CL/onlinelog/o1_mf_4__0b2z3qvo_.log
/oradata/PROD1MT101CL/onlinelog/o1_mf_5__0b3tkddo_.log
/oradata/PROD1MT101CL/onlinelog/o1_mf_6__0b4gvg2h_.log
/oradata/PROD1MT101CL/onlinelog/o1_mf_7__0b51zbqp_.log
Cleaning
# Convert the special Data Guard standby database to a snapshot standby
DGMGRL> convert database prod1mt101cl to snapshot standby;

# Now run all your cleaning scripts on this special database
SQL> @all_of_my_special_cleaning_scripts

# Cleaning is now finished successfully
# Close and reopen each PDB in READ ONLY mode
SQL> alter pluggable database all close;
SQL> alter pluggable database all open read only;

# Create XML metadata file for each PDB
SQL> exec DBMS_PDB.DESCRIBE('/nfs/pdb/apppdb1.xml','APPPDB1');
SQL> exec DBMS_PDB.DESCRIBE('/nfs/pdb/apppdb2.xml','APPPDB2');
SQL> exec DBMS_PDB.DESCRIBE('/nfs/pdb/apppdb3.xml','APPPDB3');

# Shut down the cleaning database
SQL> shutdown immediate
Snapshot
Now use your NAS toolkit (REST API for example) to create a storage level snapshot from the /nfs/pdb filesystem.
Convert Snapshot Standby back to physical standby
Use the instructions in this post to restore the cleaning instance back to being a physical standby.
Attach PDBs to test database CDB
First, use your NAS toolkit to create a thin writable from from the snapshot created earlier (or multiple clones if the test setup has a Data Guard standby, a dedicated copy for each) and mount them to the test database hosts as /nfs/newclone.
# If the test setup has Data Guard, set standby_pdb_source_file_directory
alter system set standby_pdb_source_file_directory='/nfs/newclone/PROD1MT101CL/CC1BE00B92E672FFE053F905500A1BAE/datafile/' scope=memory;

# On test primary create new pluggable database as clone
create pluggable database apppdb1_newclone as clone using '/nfs/newclone/apppdb1.xml' source_file_directory='/nfs/newclone/PROD1MT101CL/CC1BE00B92E672FFE053F905500A1BAE/datafile/' nocopy tempfile reuse;

# Open it
alter pluggable database apppdb1_newclone;
Done.
- Written by: ilmarkerm
- Category: Blog entry
- Published: February 28, 2024
Snapshot Standby is actually quite an old feature of Oracle Data Guard. According to note Doc ID 443720.1 it has been available since 11.2.
Snapshot Standby is a feature that allows temporarily to open existing physical standby database in READ WRITE mode – for example running some tests – and then convert it back to physical standby, discarding all the changes that were made during the testing. Another key feature is that the standby also retains some of the standby functions while it is open in READ WRITE mode, the snapshot standby keeps receiving redo from the primary database – just receiving, not applying. So even when you perform some testing on the standby, your data is still being protected by Data Guard. Although applying the shipped changes to the standby could take extended amount of time later.
Snapshot Standby relies on flashback database feature, but the process of converting back and forth is handled automatically by Data Guard Broker. But since it is creating a guaranteed restore point, then explicitly enabling flashback database is not required – although internally it is still flashback database so its restrictions apply.
My setup
DGMGRL> show configuration;

Configuration - devdbs02

  Protection Mode: MaxPerformance
  Members:
  devdbs02i1 - Primary database
    devdbs02i2 - Physical standby database

Fast-Start Failover:  Disabled
Two databases in the configuration – devdbs02i1 is currently primary and devdbs02i2 is physical standby that I want to use temporarily for some testing purposes.
Converting standby to snapshot standby
Here I convert devdbs02i2 to a snapshot standby, which will open it temporarily in READ WRITE mode (independently from the primary database). All the changes made in devdbs02i2 will be flashed back (lost) when the database is converted back to physical standby later.
First make sure, that you have enough disk space for recovery area available. While the database is in snapshot standby mode, the recovery area will have to store flashback logs (for the entire duration while the standby is in snapshot standby mode!), archive logs from primary database and also archive logs from your testing activities. So quite a lot of extra pressure on the recovery area. Make it large.
$ dgmgrl /
DGMGRL for Linux: Release 19.0.0.0.0 - Production on Tue Feb 27 13:18:43 2024
Version 19.21.0.0.0

Copyright (c) 1982, 2019, Oracle and/or its affiliates.  All rights reserved.

Welcome to DGMGRL, type "help" for information.
Connected to "devdbs02i2"
Connected as SYSDG.
DGMGRL> show configuration;

Configuration - devdbs02

  Protection Mode: MaxPerformance
  Members:
  devdbs02i1 - Primary database
    devdbs02i2 - Physical standby database

Fast-Start Failover:  Disabled

Configuration Status:
SUCCESS   (status updated 38 seconds ago)
And do the conversion.
DGMGRL> convert database devdbs02i2 to snapshot standby;
Converting database "devdbs02i2" to a Snapshot Standby database, please wait...
Database "devdbs02i2" converted successfully

DGMGRL> show configuration verbose;

Configuration - devdbs02

  Protection Mode: MaxPerformance
  Members:
  devdbs02i1 - Primary database
    devdbs02i2 - Snapshot standby database
So, now devdbs02i2 is in snapshot standby mode, meaning it is open READ WRITE for temporary testing purposes.
SYS @ devdbs02i2:>select open_mode, database_role from v$database;

OPEN_MODE            DATABASE_ROLE
-------------------- ----------------
READ WRITE           SNAPSHOT STANDBY
Data Guard Broker has automatically created a guaranteed restore point for us. And looks like the developer who wrote this piece of code was american and used their non-standard date format 🙁 Kudos for using standard time format tho 🙂
SYS @ devdbs02i2:>select con_id, name, GUARANTEE_FLASHBACK_DATABASE from v$restore_point;

    CON_ID NAME                                           GUA
---------- ---------------------------------------------- ---
         0 SNAPSHOT_STANDBY_REQUIRED_02/27/2024 13:20:13  YES
And devdbs02i2 still keeps receiving redo from the primary database. This is one key benefit of using a snapshot standby.
SYS @ devdbs02i2:>select process,status,thread#,sequence#,block# from v$managed_standby where process='RFS';

PROCESS   STATUS          THREAD#  SEQUENCE#     BLOCK#
--------- ------------ ---------- ---------- ----------
RFS       IDLE                  1          0          0
RFS       IDLE                  1          7       4029
RFS       IDLE                  0          0          0
And primary database still keeps sending the redo
SYS @ devdbs02i1:>select process,status,thread#,sequence#,block# from v$managed_standby where process='LGWR';

PROCESS   STATUS          THREAD#  SEQUENCE#     BLOCK#
--------- ------------ ---------- ---------- ----------
LGWR      WRITING               1          7       4078
What I also notice is that the snapshot standby incarnation has changed (as expected). The snapshot standby is on incarnation 31, while the primary database is still on 30.
SYS @ devdbs02i2:>select LAST_OPEN_INCARNATION# from v$database;

LAST_OPEN_INCARNATION#
----------------------
                    31

SYS @ devdbs02i1:>select LAST_OPEN_INCARNATION# from v$database;

LAST_OPEN_INCARNATION#
----------------------
                    30
Using the stapshot standby in read write mode
Nothing special about it, just connect and run your statements.
SYS @ devdbs02i2:>alter session set container=lbtest1;

Session altered.

SYS @ devdbs02i2:>create table ilmker.just_some_test_data as select * from all_objects union all select * from all_objects;

Table created.
Restoring the database to physical standby
After your testing is done you should return the database back to being physical standby. Before the recovery area diskspace runs out.
First mount the snapshot standby instance.
SYS @ devdbs02i2:>shu immediate
Database closed.
Database dismounted.
ORACLE instance shut down.

SYS @ devdbs02i2:>startup mount
Then connect to Broker using SYSDG privileges. With password! Broker needs to connect to the primary database, so it needs the password this time.
$ dgmgrl c##dataguard@devdbs02-2.db.example.net/devdbs02i2.dev.mt1
DGMGRL for Linux: Release 19.0.0.0.0 - Production on Wed Feb 28 16:22:02 2024
Version 19.21.0.0.0

Copyright (c) 1982, 2019, Oracle and/or its affiliates.  All rights reserved.

Welcome to DGMGRL, type "help" for information.
Password:
Connected to "devdbs02i2"
Connected as SYSDG.

DGMGRL> show configuration;

Configuration - devdbs02

  Protection Mode: MaxPerformance
  Members:
  devdbs02i1 - Primary database
    devdbs02i2 - Snapshot standby database
      Warning: ORA-16782: instance not open for read and write access

DGMGRL> convert database devdbs02i2 to physical standby;
Converting database "devdbs02i2" to a Physical Standby database, please wait...
Operation requires a connection to database "devdbs02i1"
Connecting ...
Connected to "DEVDBS02I1"
Connected as SYSDG.
Database "devdbs02i2" converted successfully

DGMGRL> show configuration;

Configuration - devdbs02

  Protection Mode: MaxPerformance
  Members:
  devdbs02i1 - Primary database
    devdbs02i2 - Physical standby database
And devdbs02i2 is back as serving as physical standby database. Really convenient feature.
Why was I writing about this quite old feature? I was exploring it for the purpose of using it to refresh our performance test databases, because they are very large, they require cleaning of PII data and we need to complete the switch to a new copy in a very short time frame. But that story is for another post.
- Written by: ilmarkerm
- Category: Blog entry
- Published: February 8, 2024
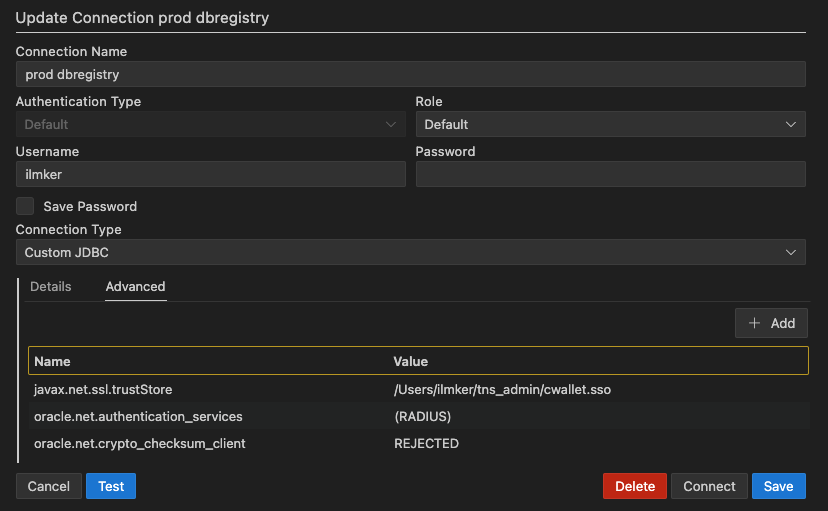
Oracle released a new SQL Developer edition, this time as extension for VS Code.
Setting up a new connection is pretty straight forward, you have all the usual connection fields available, but my first worry was that how to create a database connection if you require more advanced features turned on, for example TLS or Radius authentication.
SQL Developer extension for VS Code seems to use 21c JDBC database driver and the extra parameters can be supplied, per connection, under the advanced tab. Here is an example how to supply custom trust store for TLS encrypted connection and enabling RADIUS authentication.