Category: Blog entry
- Written by: ilmarkerm
- Category: Blog entry
- Published: July 18, 2024
We have been using Single-Sign On for APEX applications for a long time, way before there was social login feature available in APEX itself. We implemented it on web server level in front of APEX. But in order to simplify the webserver setup (mainly to disable sticky load balancer setup) and since APEX for quite some time can do some SSO protocols now internally – we finally moved to APEX social sign-in – using OpenID connector. I blogged about it here earlier.
Enabled it last evening, everything worked fine over night (low use), and suddenly, this morning, when the real use begins, application users started getting the following login failures:
The HTTP request to “https://login.microsoftonline.com/<tenancy_id>/v2.0/.well-known/openid-configuration” failed.
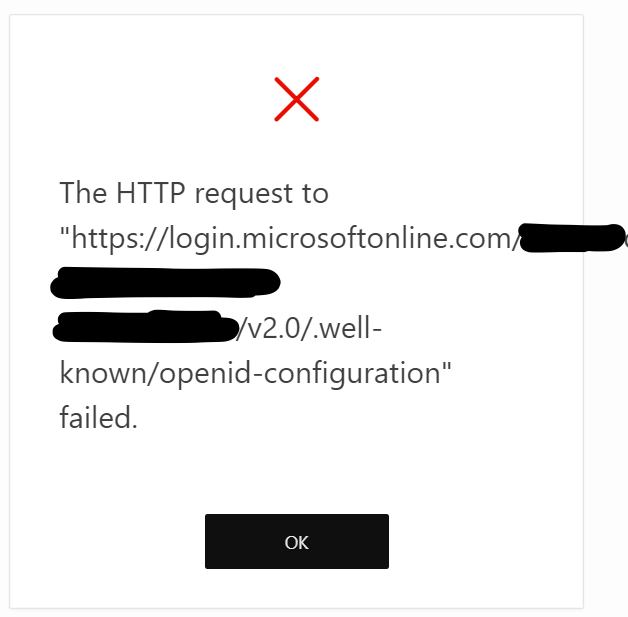
Quite un-informative… why did it fail? This URL is the OpenID discovery URL and the message comes from APEX, not Azure SSO. A few quick checks:
- The URL works, and it returns proper 200 OK status code, even from the database server
- If there were any TLS errors, then the error message would be different
- No new messages in APEX_DEBUG_MESSAGES since the issue started
- Nothing in APEX_WEBSERVICE_LOG
- Nothing in alert.log 🤔
- Changing APEX instance proxy did not help
- TLS wallet was accessible and good
- The error is returned ONLY to application users, even though builder uses the same OpenID Discovery URL – and APEX builder login works without any issues
- And every developer swore, that noone has changed anything today
As a side-note – the end-user applications are quite heavily used and there are hundreds of internal users.
Finally I started creating new Authentications scheme using Generic OAuth2 instead and they seemed to connect to Azure services without issues. But then messages started appearing in APEX_DEBUG_MESSAGES (what triggered that DEBUG logging started writing? accessing applications via Builder?) and hidden deep in messages I found the gem:
Exception in "GET https://login.microsoftonline.com/azure_tenancy_id/v2.0/.well-known/openid-configuration":
Error Stack: ORA-20001: You have exceeded the maximum number of web service requests per workspace. Please contact your administrator.
Looks like, at least in APEX 23.1, calls to OpenID discovery URL count towards the APEX workspace web service request limiter, after increasing the limit the authentication started working again.
exec APEX_INSTANCE_ADMIN.SET_PARAMETER('MAX_WEBSERVICE_REQUESTS', 100000);Problem solved, but it was quite confusing to troubleshoot due to lack of more detailed error messages. I really do not expect authentication hitting a rate limiter and then being completely silent about the underlying cause.
- Written by: ilmarkerm
- Category: Blog entry
- Published: April 14, 2024
Here I’m exploring how to control the basic network level resource security accesses. In AWS there is a concept called Security Groups. In OCI Oracle Cloud the similar concept is called Network Security Groups, also there is a little bit less powerful concept called Security Lists. A good imprevement with Network Security Groups over Security Lists is that in rules you can refer to other NSGs, not only CIDR.
Below I create two NSG – one for databases and one for application servers, and allow unrestricted outgoing traffc from them both.
# security.tf

# Rules for appservers

resource "oci_core_network_security_group" "appserver" {
    compartment_id = oci_identity_compartment.compartment.id
    vcn_id = oci_core_vcn.main.id
    display_name = "Application servers"
}

resource "oci_core_network_security_group_security_rule" "appserver_egress" {
    network_security_group_id = oci_core_network_security_group.appserver.id
    direction = "EGRESS"
    protocol = "all"
    description = "Allow all Egress traffic"
    destination = "0.0.0.0/0"
    destination_type = "CIDR_BLOCK"
}

# Rules for databases

resource "oci_core_network_security_group" "db" {
    compartment_id = oci_identity_compartment.compartment.id
    vcn_id = oci_core_vcn.main.id
    display_name = "Databases"
}

resource "oci_core_network_security_group_security_rule" "db_egress" {
    network_security_group_id = oci_core_network_security_group.db.id
    direction = "EGRESS"
    protocol = "all"
    description = "Allow all Egress traffic"
    destination = "0.0.0.0/0"
    destination_type = "CIDR_BLOCK"
}
Some rule examples to allow traffic from appservers towards databases. Here referring to the appserver NSG as source – not a CIDR.
# This rule allows port 1521/tcp to be accessed from NSG "appserver" created earlier
resource "oci_core_network_security_group_security_rule" "db_appserver_oracle" {
    network_security_group_id = oci_core_network_security_group.db.id
    direction = "INGRESS"
    protocol = "6" # TCP
    description = "Allow ingress from application servers to 1521/tcp"
    source_type = "NETWORK_SECURITY_GROUP"
    source = oci_core_network_security_group.appserver.id
    tcp_options {
        destination_port_range {
            min = 1521
            max = 1521
        }
    }
}

# This rule allows port 5432/tcp to be accessed from NSG "appserver" created earlier
resource "oci_core_network_security_group_security_rule" "db_appserver_postgres" {
    network_security_group_id = oci_core_network_security_group.db.id
    direction = "INGRESS"
    protocol = "6" # TCP
    description = "Allow ingress from application servers to 5432/tcp"
    source_type = "NETWORK_SECURITY_GROUP"
    source = oci_core_network_security_group.appserver.id
    tcp_options {
        destination_port_range {
            min = 5432
            max = 5432
        }
    }
}
And one example rule for appserver group, here I just want to show that the source NSG can refer to itself – so the port is open only to resources placed in the same NSG.
# This rule allows port 80/tcp to be accessed from the NSG itself
# Example use - the application is running unencrypted HTTP and is expected to have a loadbalancer in front, that does the encryption. In this case loadbalancer could be put to the same NSG.
# Or if the different application servers need to have a backbone communication port between each other - like cluster interconnect
resource "oci_core_network_security_group_security_rule" "appserver_http" {
    network_security_group_id = oci_core_network_security_group.appserver.id
    direction = "INGRESS"
    protocol = "6" # TCP
    description = "Allow access port port 80/tcp only from current NSG (self)"
    source_type = "NETWORK_SECURITY_GROUP"
    source = oci_core_network_security_group.appserver.id
    tcp_options {
        destination_port_range {
            min = 80
            max = 80
        }
    }
}
Now, network security groups need to be attached to the resources they are intended to protect. NSG-s are attached to the virtual network adapers VNICs.
To attach NSG to my previously created compute instance, I have to go back and edit the compute instance declaration to attach a NSG to the primary VNIC of that instance.
# compute.tf

resource "oci_core_instance" "arm_instance" {
    compartment_id = oci_identity_compartment.compartment.id
    # oci iam availability-domain list
    availability_domain = "MpAX:EU-STOCKHOLM-1-AD-1"
    # oci compute shape list --compartment-id
    shape = "VM.Standard.A1.Flex" # ARM based shape
    shape_config {
        # How many CPUs and memory
        ocpus = 2
        memory_in_gbs = 4
    }
    display_name = "test-arm-1"
    source_details {
        # The source operating system image
        # oci compute image list --all --output table --compartment-id
        source_id = data.oci_core_images.oel.images[0].id
        source_type = "image"
    }
    create_vnic_details {
        # Network details
        subnet_id = oci_core_subnet.subnet.id
        assign_public_ip = true
        # attaching Network Security Groups - NSGs
        nsg_ids = [oci_core_network_security_group.appserver.id]
    }
    # CloudInit metadata - including my public SSH key
    metadata = {
        ssh_authorized_keys = "ssh-rsa AAAAB3NzaC1yc2EAAAADAQABAAABgQCZ4bqPK+Mwiy+HLabqJxCMcQ/hY7IPx/oEQZWZq7krJxkLLUI6lkw44XRCutgww1q91yTdsSUNDZ9jFz9LihGTEIu7CGKkzmoGtAWHwq2W38GuA5Fqr0r2vPH1qwkTiuN+VmeKJ+qzOfm9Lh1zjD5e4XndjxiaOrw0wI19zpWlUnEqTTjgs7jz9X7JrHRaimzS3PEF5GGrT6oy6gWoKiWSjrQA2VGWI0yNQpUBFTYWsKSHtR+oJHf2rM3LLyzKcEXnlUUJrjDqNsbbcCN26vIdCGIQTvSjyLj6SY+wYWJEHCgPSbBRUcCEcwp+bATDQNm9L4tI7ZON5ZiJstL/sqIBBXmqruh7nSkWAYQK/H6PUTMQrUU5iK8fSWgS+CB8CiaA8zos9mdMfs1+9UKz0vMDV7PFsb7euunS+DiS5iyz6dAz/uFexDbQXPCbx9Vs7TbBW2iPtYc6SNMqFJD3E7sb1SIHhcpUvdLdctLKfnl6cvTz2o2VfHQLod+mtOq845s= ilmars_public_key"
    }
}- Written by: ilmarkerm
- Category: Blog entry
- Published: April 7, 2024
Continusing to build Oracle Cloud Infrastructure with Terraform. Today moving on to compute instances.
But first some networking, the VCN I created earlier did not have access to the internet. Lets fix it now. The code below will add an Internet Gateway and modify the default route table to send out the network traffic via the Internet Gateway.
# network.tf

resource "oci_core_internet_gateway" "internet_gateway" {
    compartment_id = oci_identity_compartment.compartment.id
    vcn_id = oci_core_vcn.main.id
    # Internet Gateway cannot be associated with Route Table here, otherwise adding a route table rule will error with - Rules in the route table must use private IP as a target.
    #route_table_id = oci_core_vcn.main.default_route_table_id
}

resource "oci_core_default_route_table" "default_route_table" {
    manage_default_resource_id = oci_core_vcn.main.default_route_table_id
    compartment_id = oci_identity_compartment.compartment.id
    display_name = "Default Route Table for VCN"
    route_rules {
        network_entity_id = oci_core_internet_gateway.internet_gateway.id
        destination = "0.0.0.0/0"
        destination_type = "CIDR_BLOCK"
    }
}
Moving on to the compute instance itself. First question is – what operating system should it run – what is the source image. There is a data source for this. Here I select the latest Oracle Linux 9 image for ARM.
data "oci_core_images" "oel" {
    compartment_id = oci_identity_compartment.compartment.id
    operating_system = "Oracle Linux"
    operating_system_version = "9"
    shape = "VM.Standard.A1.Flex"
    state = "AVAILABLE"
    sort_by = "TIMECREATED"
    sort_order = "DESC"
}

# Output the list for debugging
output "images" {
    value = data.oci_core_images.oel
}
We are now ready to create the compute instance itself. In the metadata I provide my SSH public key, so I could SSH into the server.
resource "oci_core_instance" "arm_instance" {
    compartment_id = oci_identity_compartment.compartment.id
    # oci iam availability-domain list
    availability_domain = "MpAX:EU-STOCKHOLM-1-AD-1"
    # oci compute shape list --compartment-id
    shape = "VM.Standard.A1.Flex" # ARM based shape
    shape_config {
        # How many CPUs and memory
        ocpus = 2
        memory_in_gbs = 4
    }
    display_name = "test-arm-1"
    source_details {
        # The source operating system image
        # oci compute image list --all --output table --compartment-id
        source_id = data.oci_core_images.oel.images[0].id
        source_type = "image"
    }
    create_vnic_details {
        # Network details
        subnet_id = oci_core_subnet.subnet.id
        assign_public_ip = true
    }
    # CloudInit metadata - including my public SSH key
    metadata = {
        ssh_authorized_keys = "ssh-rsa AAAAB3NzaC1yc2EAAAADAQABAAABgQCZ4bqPK+Mwiy+HLabqJxCMcQ/hY7IPx/oEQZWZq7krJxkLLUI6lkw44XRCutgww1q91yTdsSUNDZ9jFz9LihGTEIu7CGKkzmoGtAWHwq2W38GuA5Fqr0r2vPH1qwkTiuN+VmeKJ+qzOfm9Lh1zjD5e4XndjxiaOrw0wI19zpWlUnEqTTjgs7jz9X7JrHRaimzS3PEF5GGrT6oy6gWoKiWSjrQA2VGWI0yNQpUBFTYWsKSHtR+oJHf2rM3LLyzKcEXnlUUJrjDqNsbbcCN26vIdCGIQTvSjyLj6SY+wYWJEHCgPSbBRUcCEcwp+bATDQNm9L4tI7ZON5ZiJstL/sqIBBXmqruh7nSkWAYQK/H6PUTMQrUU5iK8fSWgS+CB8CiaA8zos9mdMfs1+9UKz0vMDV7PFsb7euunS+DiS5iyz6dAz/uFexDbQXPCbx9Vs7TbBW2iPtYc6SNMqFJD3E7sb1SIHhcpUvdLdctLKfnl6cvTz2o2VfHQLod+mtOq845s= ilmars_public_key"
    }
}
And attach the block storage volumes I created in the previous post. Here I create attachments as paravirtualised, meaning the volumes appear on server as sd* devices, but also iSCSI is possible.
resource "oci_core_volume_attachment" "test_volume_attachment" {
    attachment_type = "paravirtualized"
    instance_id = oci_core_instance.arm_instance.id
    volume_id = oci_core_volume.test_volume.id

    # Interesting options, could be useful in some cases
    is_pv_encryption_in_transit_enabled = false
    is_read_only = false
    is_shareable = false
}

resource "oci_core_volume_attachment" "silver_test_volume_attachment" {
    # This is to enforce device attachment ordering
    depends_on = [oci_core_volume_attachment.test_volume_attachment]

    attachment_type = "paravirtualized"
    instance_id = oci_core_instance.arm_instance.id
    volume_id = oci_core_volume.silver_test_volume.id

    # Interesting options, could be useful in some cases
    is_pv_encryption_in_transit_enabled = false
    is_read_only = true
    is_shareable = false
}
Looks like OCI support some interesting options for attaching volumes, like encryption, read only and shareable. I can see them being useful in the future. If I log into the created server, the attached devices are created as sdb and sdc – where sdc was instructed to be read only. And indeed it is.
[root@test-arm-1 ~]# lsblk
NAME               MAJ:MIN RM  SIZE RO TYPE MOUNTPOINTS
sda                  8:0    0 46.6G  0 disk
├─sda1               8:1    0  100M  0 part /boot/efi
├─sda2               8:2    0    2G  0 part /boot
└─sda3               8:3    0 44.5G  0 part
  ├─ocivolume-root 252:0    0 29.5G  0 lvm  /
  └─ocivolume-oled 252:1    0   15G  0 lvm  /var/oled
sdb                  8:16   0   50G  0 disk
sdc                  8:32   0   50G  1 disk

[root@test-arm-1 ~]# dd if=/dev/zero of=/dev/sdb bs=1M count=10
10+0 records in
10+0 records out
10485760 bytes (10 MB, 10 MiB) copied, 0.0453839 s, 231 MB/s

[root@test-arm-1 ~]# dd if=/dev/zero of=/dev/sdc bs=1M count=10
dd: failed to open '/dev/sdc': Read-only file system- Written by: ilmarkerm
- Category: Blog entry
- Published: April 1, 2024
Continuing my series of exploring Oracle Cloud, with the help of Terraform code. You can find the previous post here. I will be referring to resources created in the earlier post.
Object store
Oracle Cloud does provide S3 style Object Storage, that is just called Buckets. Buckets can also speak S3 protocol, so they are usable for applications that speak S3.
One difference from AWS S3 is that in Oracle Buckets the storage class/tier is not at the object level, you have to specify during the creation of the Bucket if it is at the Standard or Archive tier.
Here I create two Buckets, one in standard tier and one archival.
# object_storage.tf

data "oci_objectstorage_namespace" "user_namespace" {
    compartment_id = oci_identity_compartment.compartment.id
}

resource "oci_objectstorage_bucket" "standard_bucket" {
    # Referencing compartment from earlier
    compartment_id = oci_identity_compartment.compartment.id
    name = "my-standard-tier-bucket"
    namespace = data.oci_objectstorage_namespace.user_namespace.namespace
    access_type = "NoPublicAccess"
    auto_tiering = "Disabled"
    object_events_enabled = true
    versioning = "Enabled"
    storage_tier = "Standard"
}

resource "oci_objectstorage_bucket" "archive_bucket" {
    # Referencing compartment from earlier
    compartment_id = oci_identity_compartment.compartment.id
    name = "my-archival-bucket"
    namespace = data.oci_objectstorage_namespace.user_namespace.namespace
    access_type = "NoPublicAccess"
    auto_tiering = "Disabled"
    object_events_enabled = false
    versioning = "Disabled"
    storage_tier = "Archive"
}
And also adding some lifecycle policies. One to abort multipart uploads that have not finished in days and also one policy to delete old object versions.
# object_storage.tf

# Bucket lifecycle policies

resource "oci_objectstorage_object_lifecycle_policy" "standard_bucket" {
    bucket = oci_objectstorage_bucket.standard_bucket.name
    namespace = data.oci_objectstorage_namespace.user_namespace.namespace

    rules {
        action = "ABORT"
        is_enabled = true
        name = "delete-uncommitted-multipart-uploads"
        target = "multipart-uploads"
        time_amount = 2
        time_unit = "DAYS"
    }
    rules {
        action = "DELETE"
        is_enabled = true
        name = "delete-old-versions"
        target = "previous-object-versions"
        time_amount = 60
        time_unit = "DAYS"
    }
}

resource "oci_objectstorage_object_lifecycle_policy" "archive_bucket" {
    bucket = oci_objectstorage_bucket.archive_bucket.name
    namespace = data.oci_objectstorage_namespace.user_namespace.namespace

    rules {
        action = "ABORT"
        is_enabled = true
        name = "delete-uncommitted-multipart-uploads"
        target = "multipart-uploads"
        time_amount = 2
        time_unit = "DAYS"
    }
}
Block storage
A very good improvement over AWS is that in Oracle Cloud you can define declarative backup policies for block storage used in your compute instances. They are automatic snapshots, that are also cleaned up automatically after the retention period has expired. Lets start with that and define a backup policy that is executed every day at 0:00 UTC and kept for 60 days.
# block_storage.tf

resource "oci_core_volume_backup_policy" "test_policy" {
    compartment_id = oci_identity_compartment.compartment.id
    display_name = "Block storage backup policy for testing"
    schedules {
        backup_type = "INCREMENTAL"
        period = "ONE_DAY"
        hour_of_day = 1
        time_zone = "UTC"
        # Keep backups for 60 days
        retention_seconds = 3600*24*60
    }
}
There are also some backup policies already defined by Oracle. Sadly you cannot specify in data resource the name of the policy you want to address, so some array magic is needed when using it later.
# block_storage.tf

data "oci_core_volume_backup_policies" "oracle_defined" {}

# For examining the output
output "oracle_defined_volume_backup_policies" {
    value = data.oci_core_volume_backup_policies.oracle_defined
}
Now lets create some block storage volumes. First volume is the cheapest, lowest performance; and the second volume is using balanced performance profile.
# block_storage.tf

resource "oci_core_volume" "test_volume" {
    compartment_id = oci_identity_compartment.compartment.id
    # List availability domains
    # oci iam availability-domain list
    availability_domain = "MpAX:EU-STOCKHOLM-1-AD-1"
    is_auto_tune_enabled = false
    size_in_gbs = 50
    # vpus_per_gb = 0 - low cost option
    vpus_per_gb = 0
}

resource "oci_core_volume" "silver_test_volume" {
    compartment_id = oci_identity_compartment.compartment.id
    # List availability domains
    # oci iam availability-domain list
    availability_domain = "MpAX:EU-STOCKHOLM-1-AD-1"
    is_auto_tune_enabled = false
    size_in_gbs = 50
    # vpus_per_gb = 10 - balanced performance option
    vpus_per_gb = 10
}
And lets attach the volumes to their backup policies. First volume the the policy I created earlier and the second volume to Oracle defined backup policy.
resource "oci_core_volume_backup_policy_assignment" "test_volume" {
    asset_id = oci_core_volume.test_volume.id
    # Attach to user defined policy
    policy_id = oci_core_volume_backup_policy.test_policy.id
}

resource "oci_core_volume_backup_policy_assignment" "silver_test_volume" {
    asset_id = oci_core_volume.silver_test_volume.id
    # Attach to Silver policy
    policy_id = data.oci_core_volume_backup_policies.oracle_defined.volume_backup_policies[1].id
}- Written by: ilmarkerm
- Category: Blog entry
- Published: March 24, 2024
I thought I’ll start exploring Oracle Cloud offerings a little and try building something with Terraform.
The execution environment
OCI Could Console offers Cloud Shell and Code Editor right from the browser. Cloud Shell is a small Oracle Linux container with shell access, that has the most popular cloud tools and OCI SDKs already deployed. Most importantly, however, all Oracle Cloud API commands you execute from there, they run silently as yourself, no additional setup required. Including setting up terraform. Pretty awesome idea I would say – no need to set up any admin computer first.
Since I would mainly write code, I’m going to use only only Code Editor (which is actually VS Code in your browser) and VS Code also has a built in terminal for executing commands.
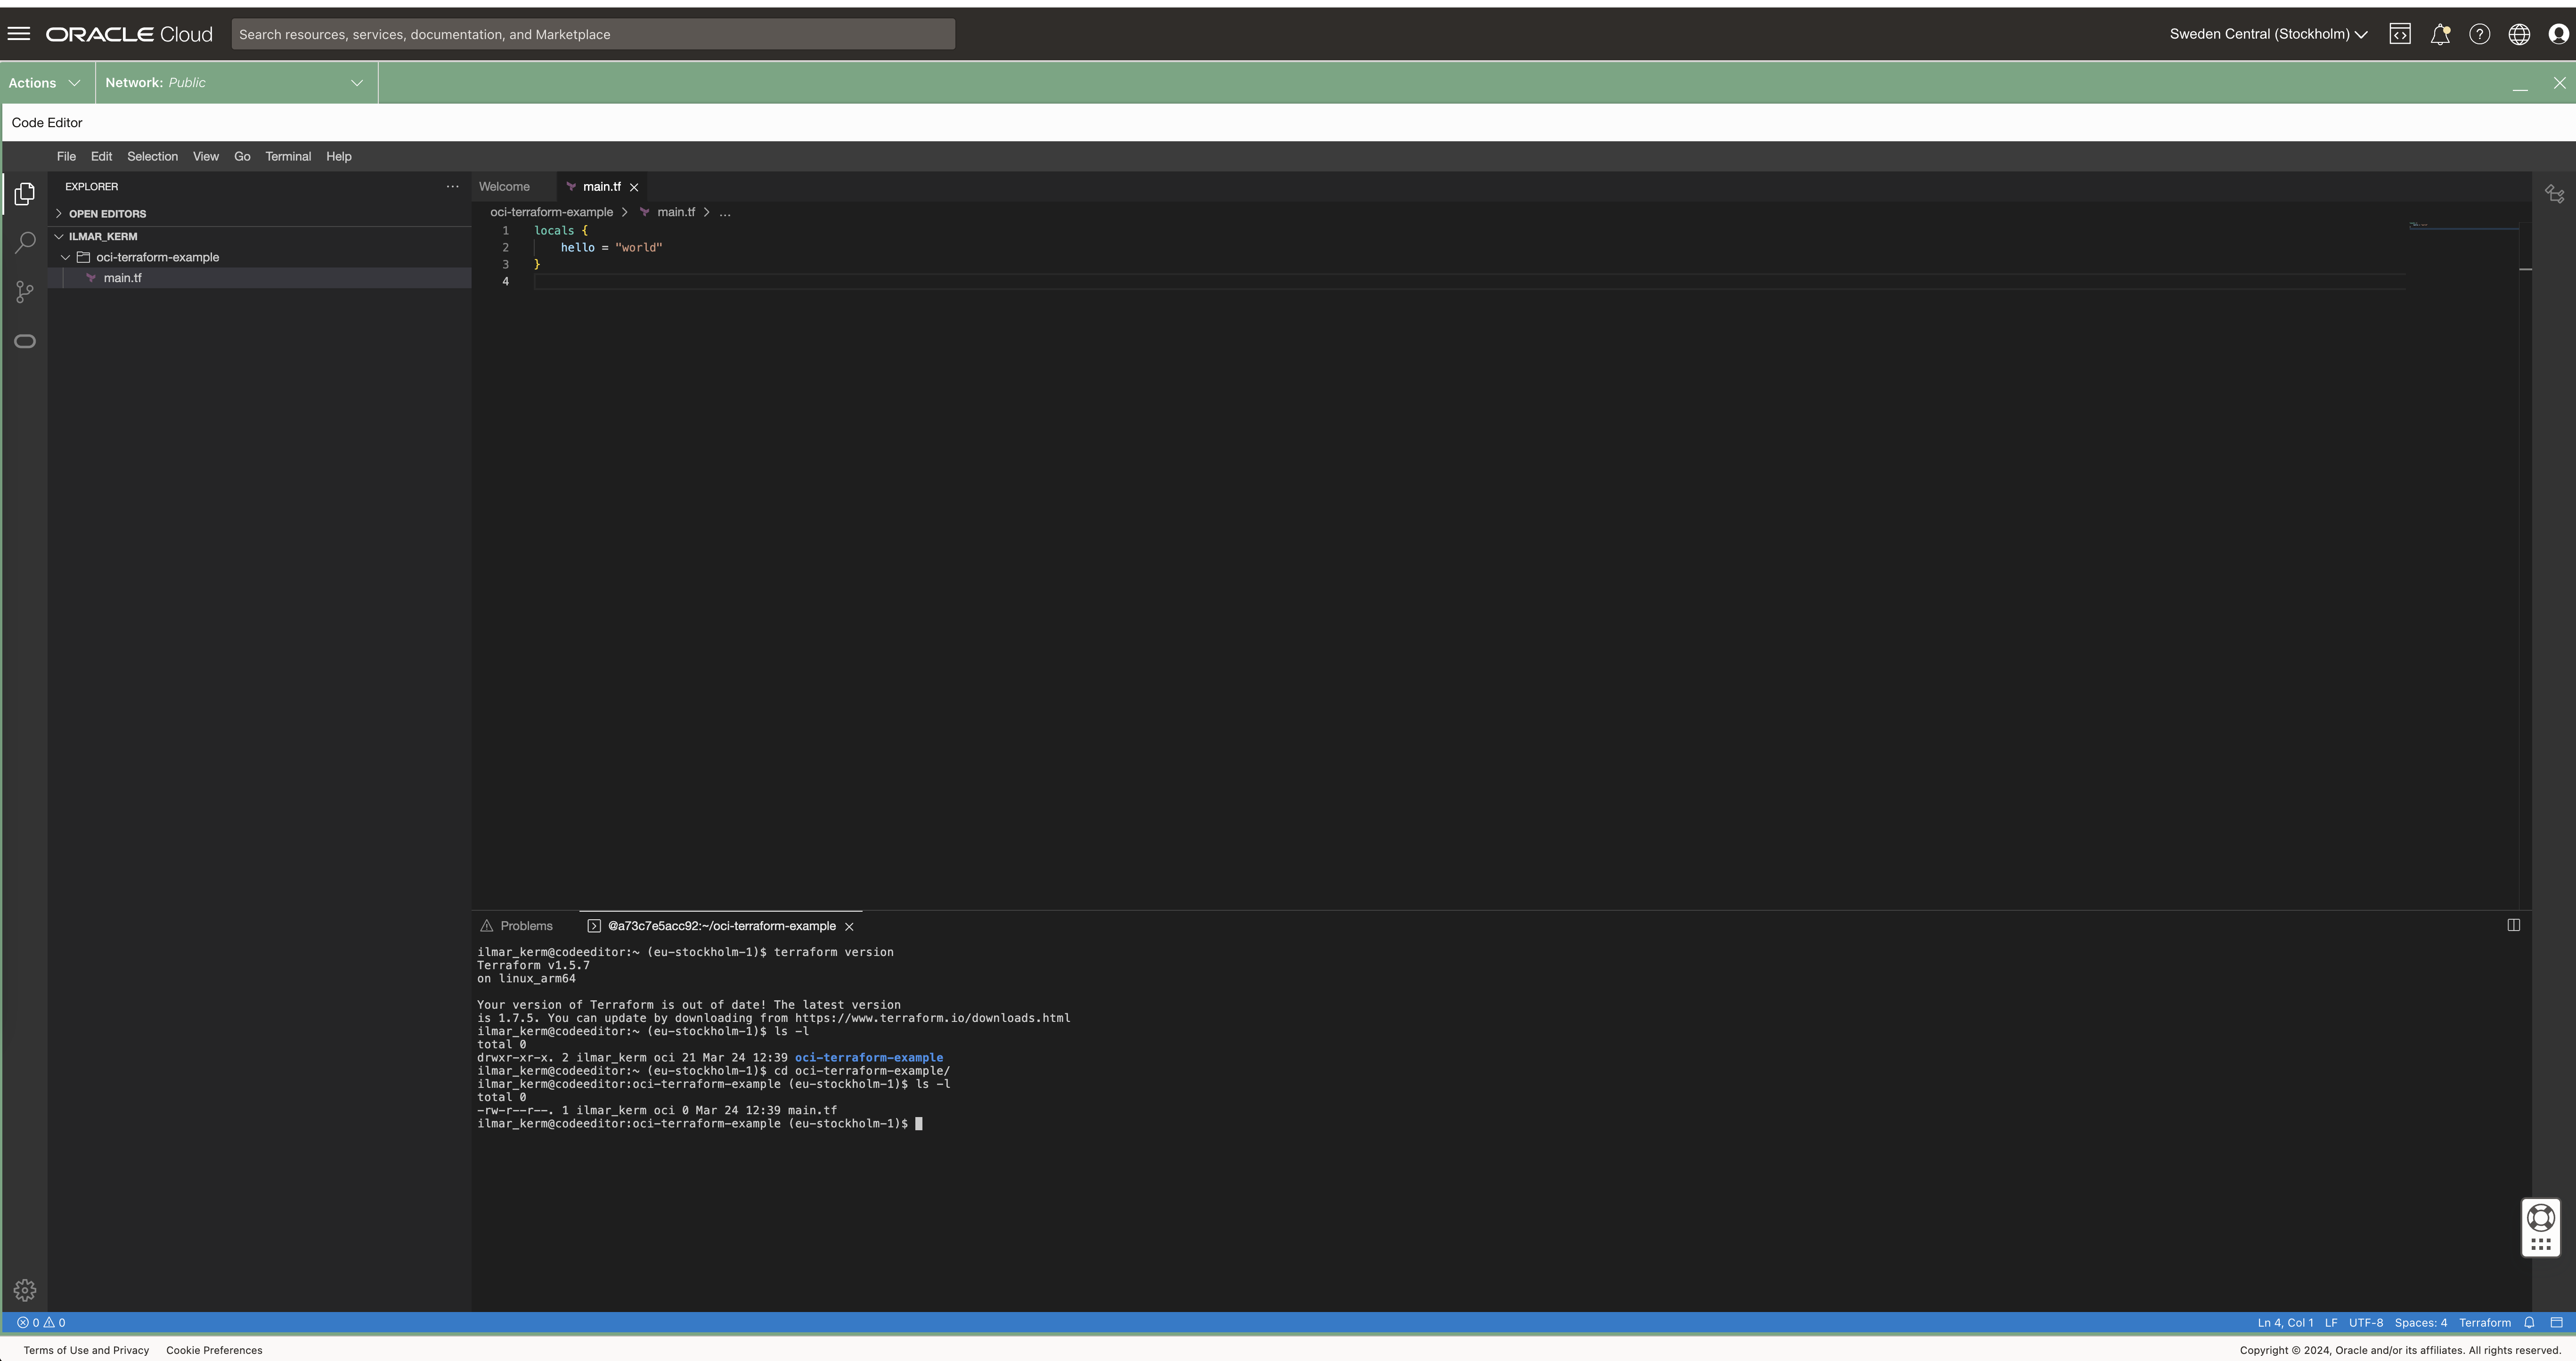
Read about executing and using Cloud Shell here.
Setting up Terraform provider
When executing from Cloud Shell / Code Editor, then setting up the terraform provider is very simple.
# versions.tf

provider "oci" {
   region = "eu-stockholm-1"
}
It is very good practice to also place terraform state file in the shared object store. OCI also provides an object store and to set it up first create a Bucket in Object Storage.
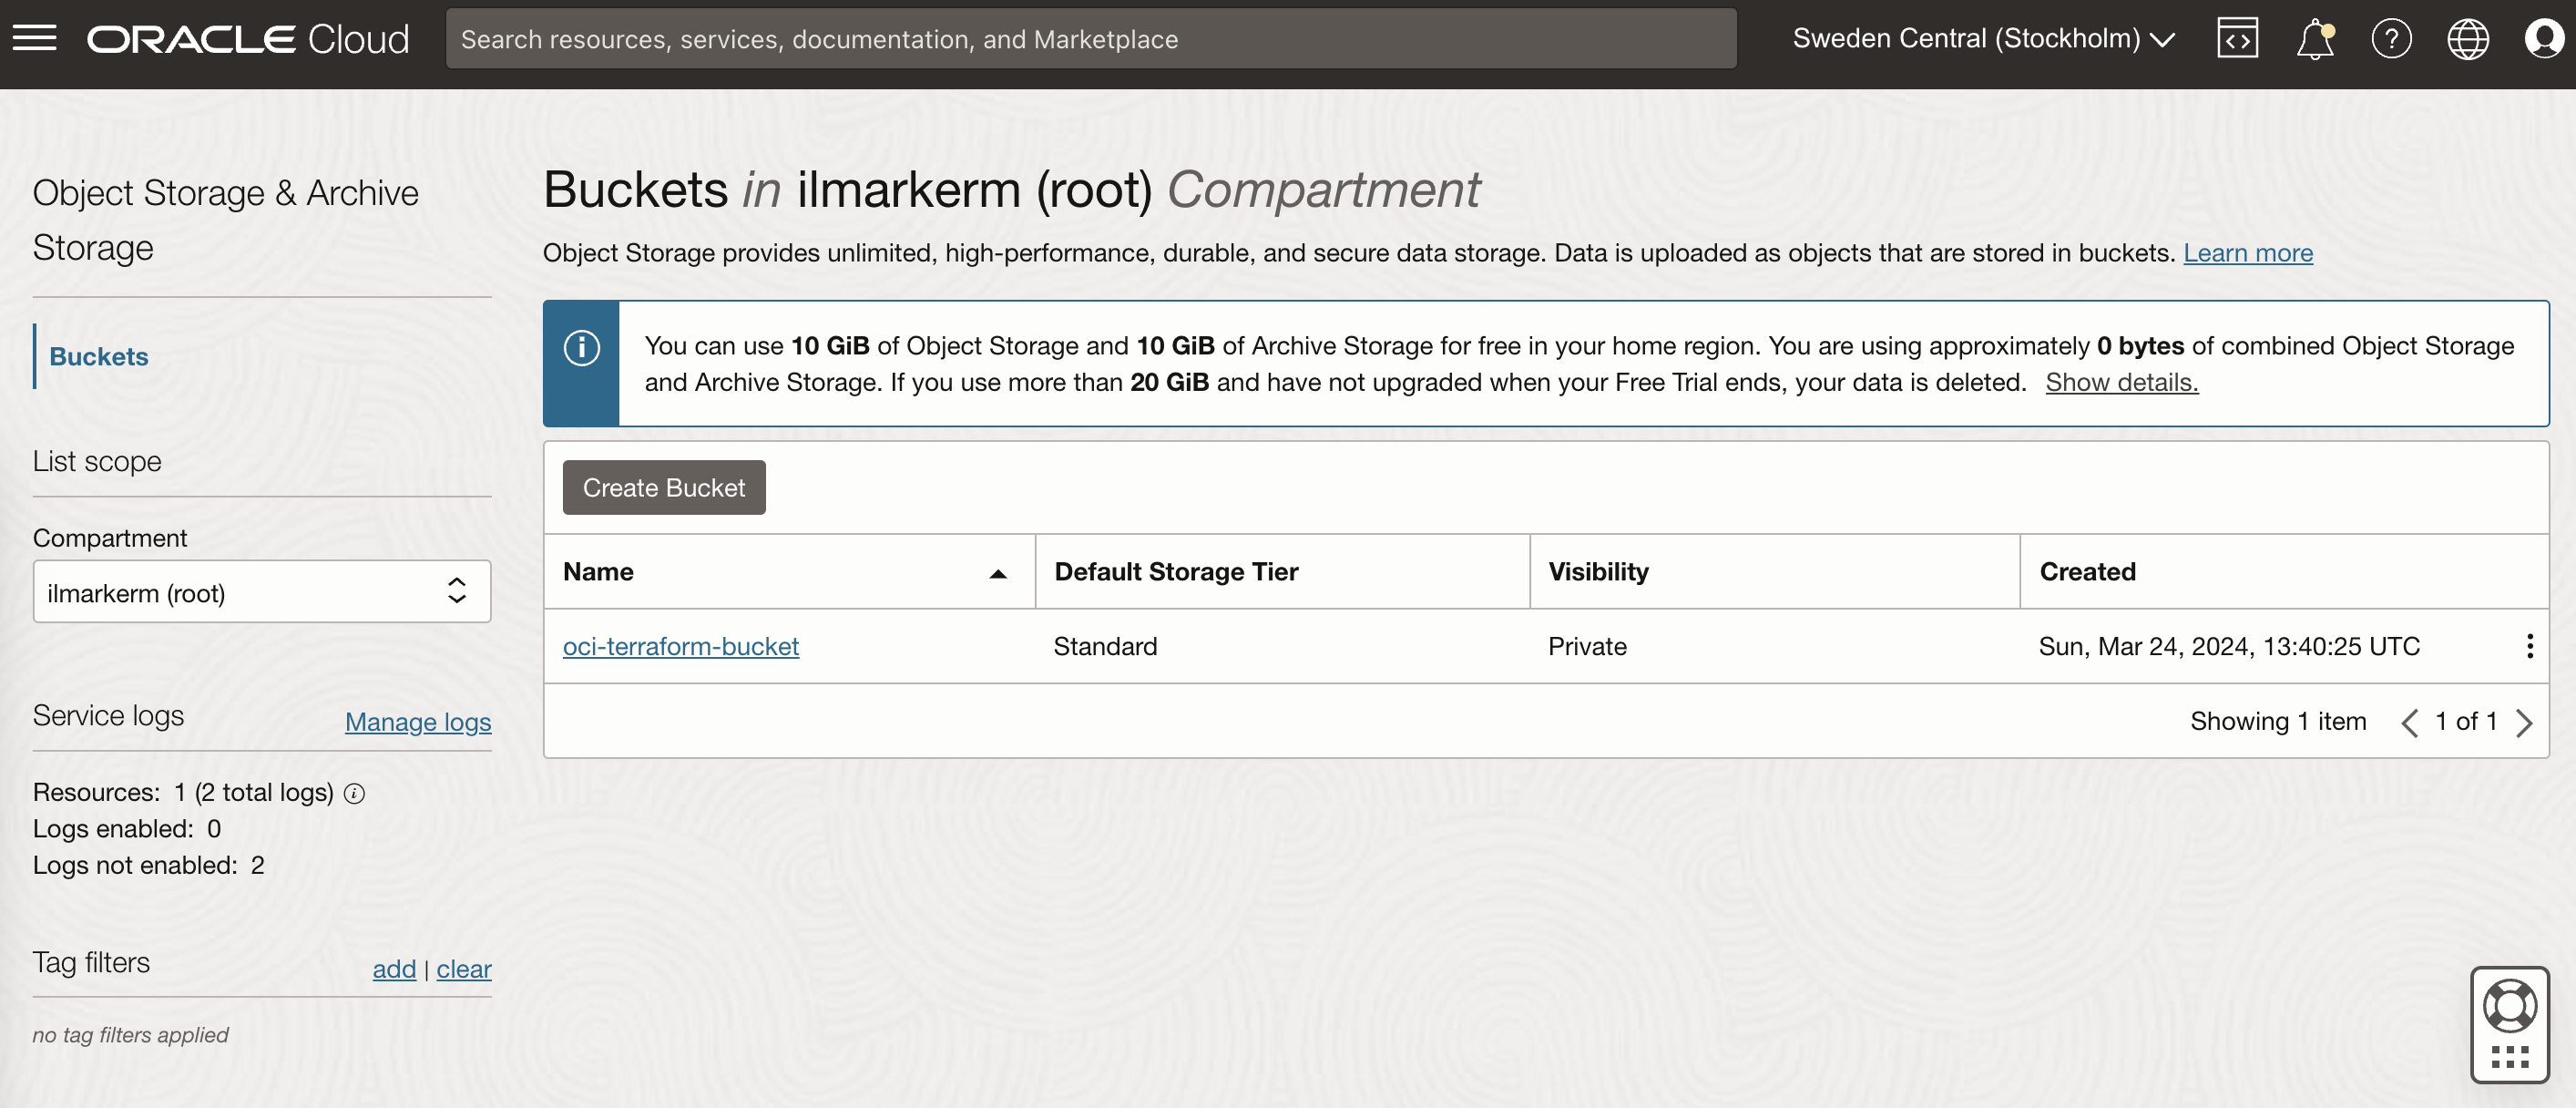
This also requires setting up Customer Secret Keys, for accessing the bucket using S3 protocol. I’m going to save my access key and secret access key in a file named bucket.credentials.
# bucket.credentials

[default]
aws_access_key_id=here is your access key
aws_secret_access_key=here is your secret access key


# remote_state.tf

terraform {
    backend "s3" {
        bucket = "oci-terraform-bucket"
        key    = "oci-terraform.tfstate"
        region = "eu-stockholm-1"
        # ax9u97qgbo5h is the namespace of the bucket, it is shown in the Bucket Details page
        endpoint = "https://ax9u97qgbo5h.compat.objectstorage.eu-stockholm-1.oraclecloud.com"
        shared_credentials_file     = "bucket.credentials"
        skip_region_validation      = true
        skip_credentials_validation = true
        skip_metadata_api_check     = true
        force_path_style            = true
    }
}
Creating compartment and basic networking
Compartment is just a handy hierarchical logical container which helps to organise your Oracle Cloud resources better. It can also be used to set common tags for all resources created under it.
# main.tf
locals {
tenancy_id = "ocid1.tenancy.oc1..aaaaaaaawf2fv3ipfdp564ffiqpfqr6u6n3uofydgtihq3wget5357lq5i6a"
environment = "dev"
}
# Information about current tenancy, for example home region
data "oci_identity_tenancy" "tenancy" {
tenancy_id = local.tenancy_id
}
# Get the parent compartment as a terraform object
data "oci_identity_compartment" "parent_compartment" {
# Top get list of existing compartments execute:
# oci iam compartment list
id = data.oci_identity_tenancy.tenancy.id
}
# Create compartment
resource "oci_identity_compartment" "compartment" {
# Compartment_id must be the parent compartment ID and it is required
compartment_id = data.oci_identity_compartment.parent_compartment.id
description = "oci-terraform experiments"
name = "oci-terraform-experiments"
# Define some default tags that are added to all resources created under this compartment
freeform_tags = {
"deployed_by" = "terraform"
"environment" = local.environment
}
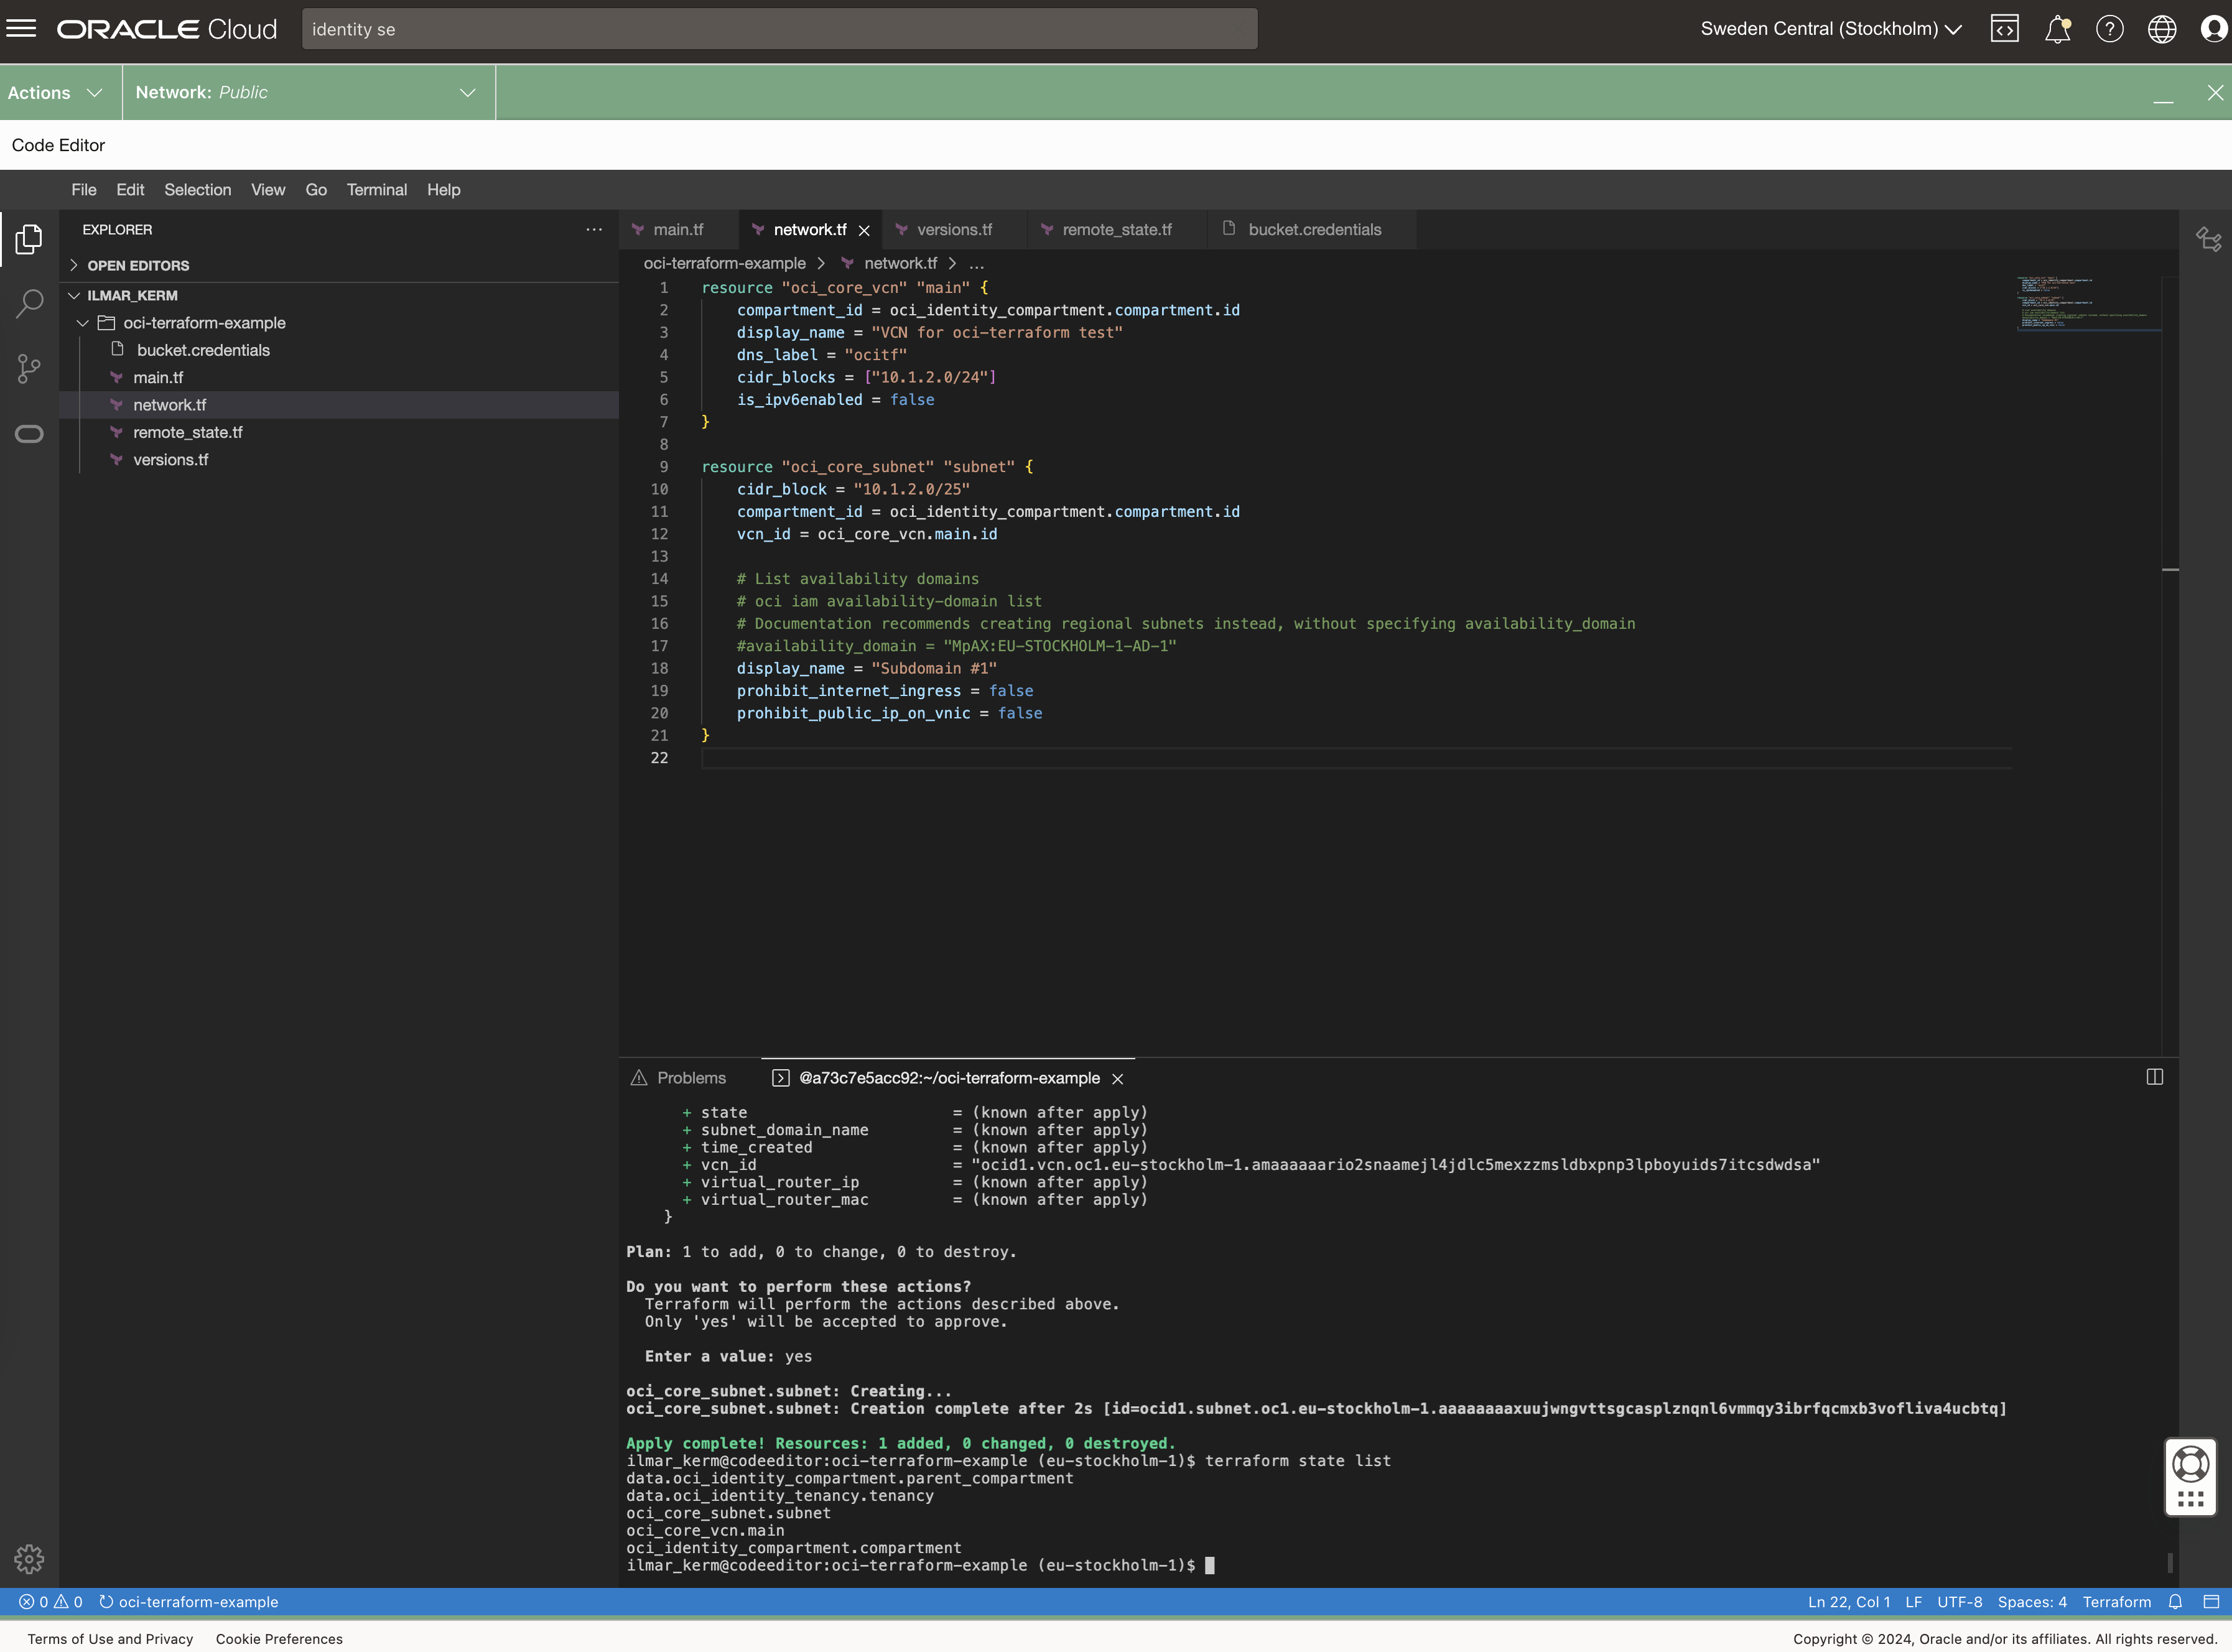
}To set up networking, first you need VCN Virtual Cloud Network and under it subnets.
# network.tf

resource "oci_core_vcn" "main" {
    compartment_id = oci_identity_compartment.compartment.id
    display_name = "VCN for oci-terraform test"
    dns_label = "ocitf"
    cidr_blocks = ["10.1.2.0/24"]
    is_ipv6enabled = false
}

resource "oci_core_subnet" "subnet" {
    cidr_block = "10.1.2.0/25"
    compartment_id = oci_identity_compartment.compartment.id
    vcn_id = oci_core_vcn.main.id

    # List availability domains
    # oci iam availability-domain list
    # Documentation recommends creating regional subnets instead, without specifying availability_domain
    #availability_domain = "MpAX:EU-STOCKHOLM-1-AD-1"
    display_name = "Subdomain #1"
    prohibit_internet_ingress = false
    prohibit_public_ip_on_vnic = false
}
To be continued
I don’t really know where this post series is going. I’ve done quite a bit of Terraforming in AWS, so here I’m just exporing what Oracle Cloud has to offer and instead of using the dreaded ClickOps, I’ll try to be proper with Terraform.
At the end of the post I have these resources created.